Bitcoin in October 2026: a 31% drawdown, a debt wall, and a halving 556 days out
Bitcoin is 31% below its October 2025 high and 47% above its July 2026 low. What the hashrate, the ETF flows and a $40.3 trillion debt load actually say — and the strongest case against the argument.
5 Oct 20262,789 words · 12 minAlso on Nostr as a long-form note
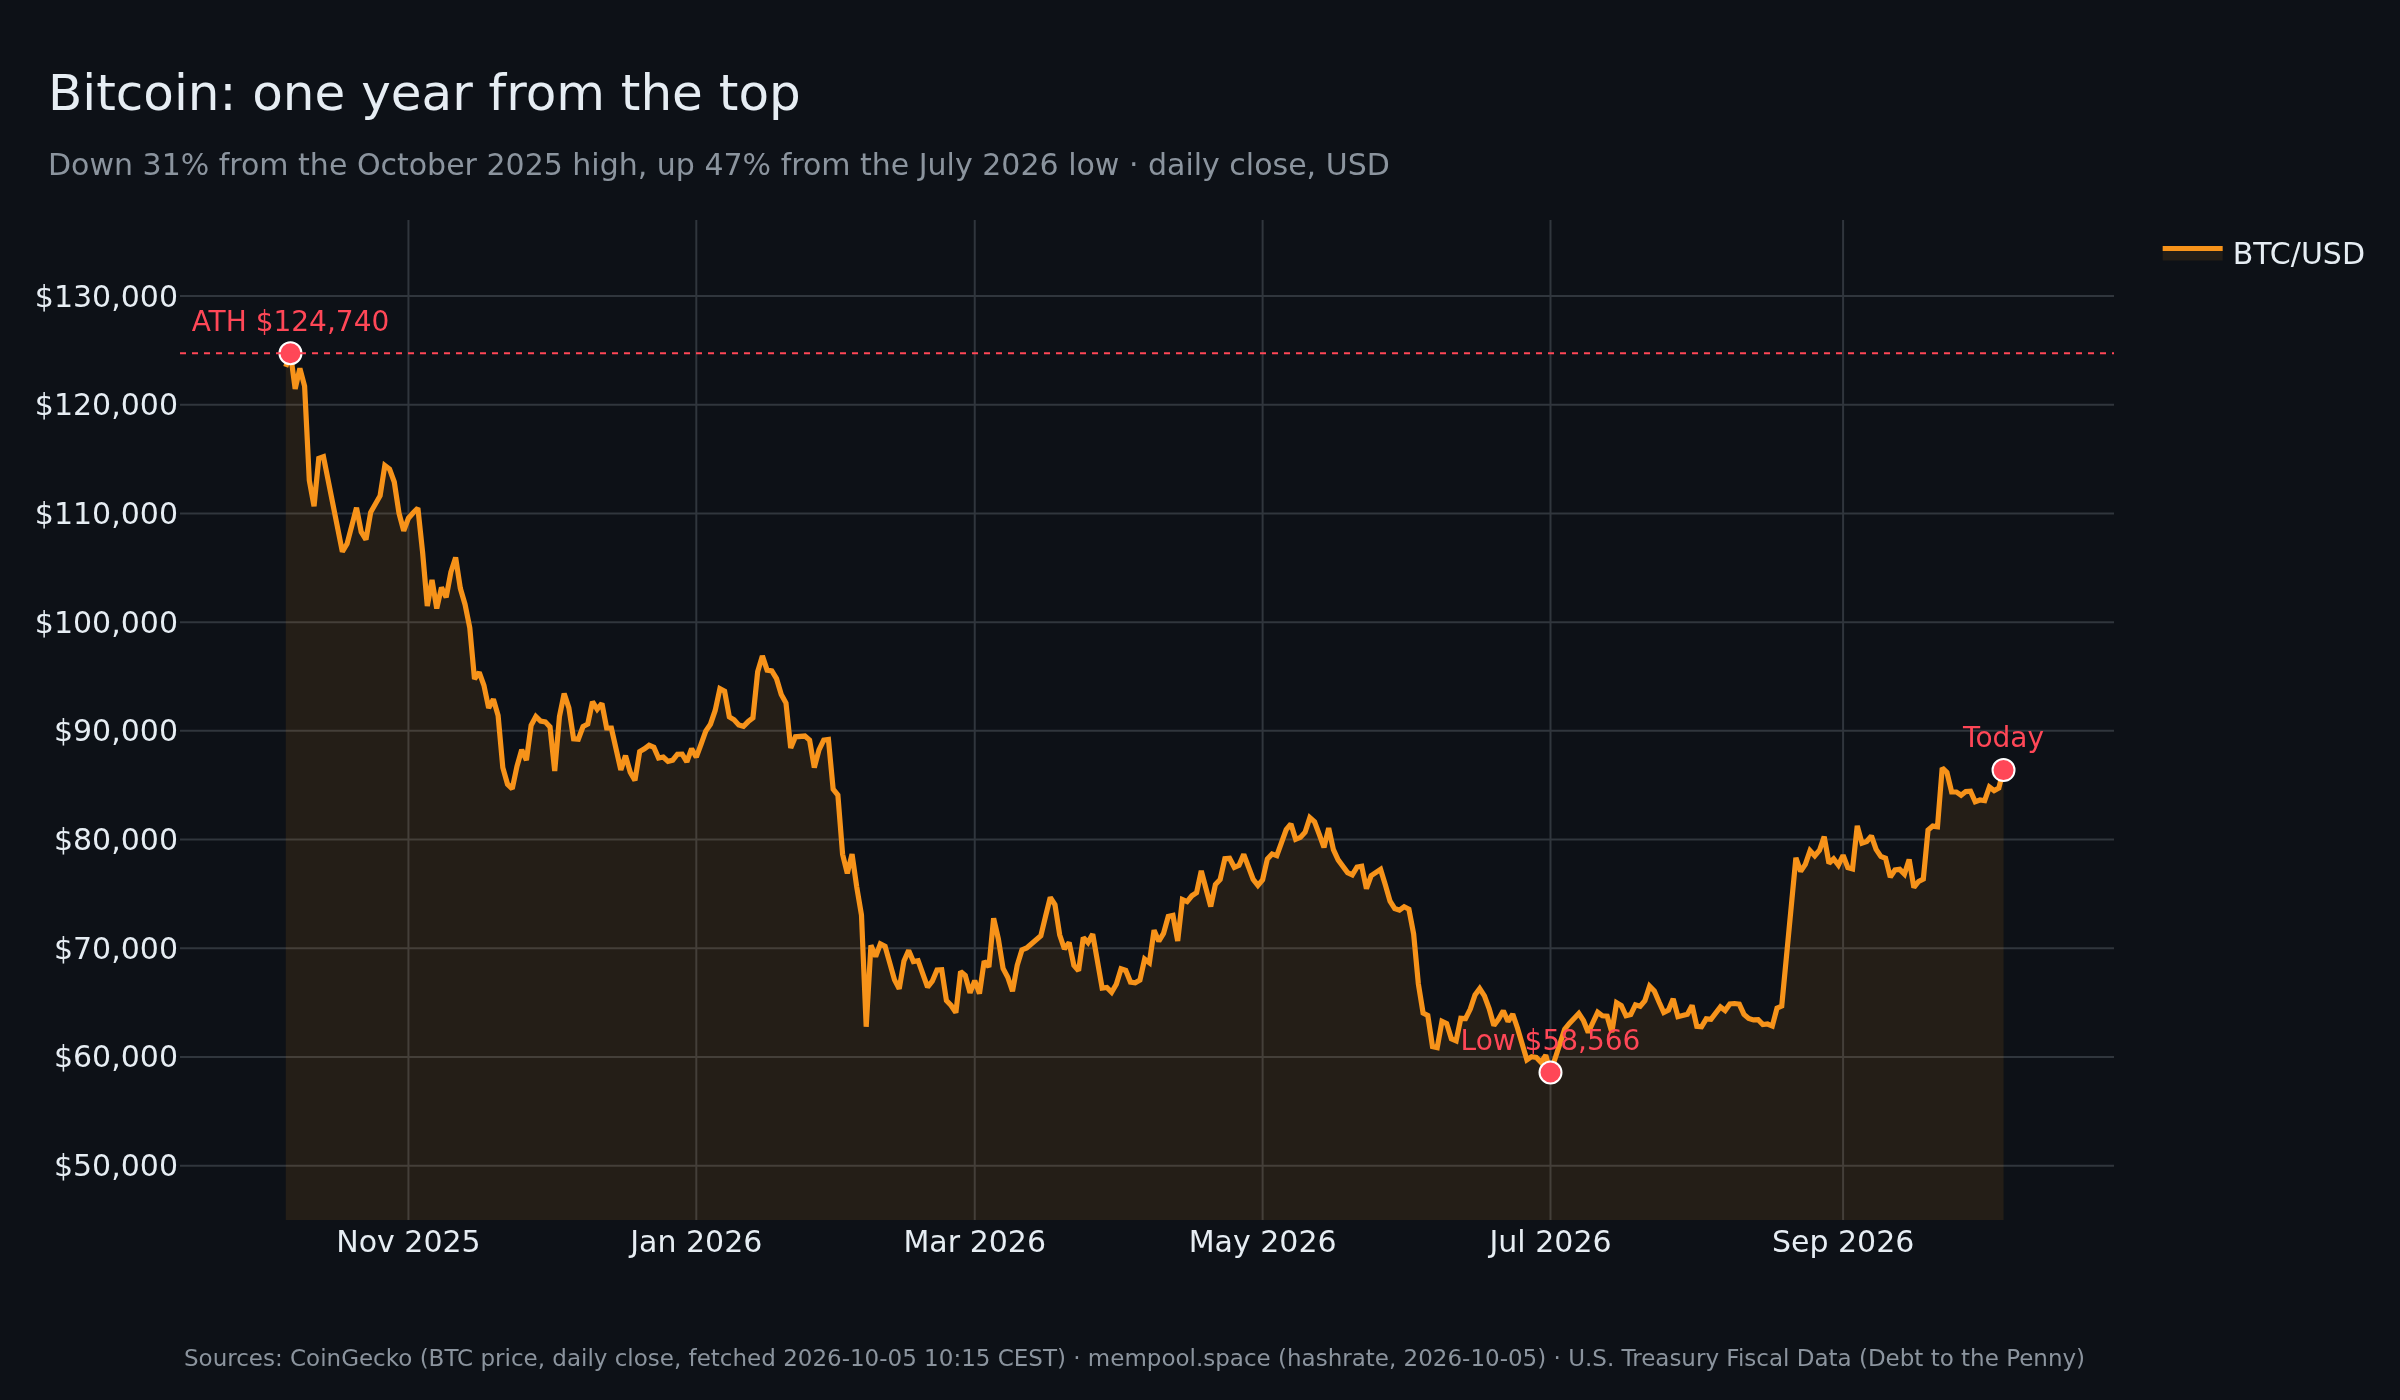
Bitcoin trades at $86,231 this morning (CoinGecko, 05 October 2026, 10:48 CEST). That number sits between two others, and the distance to each of them is the whole story: it is 31% below the record set on 6 October 2025, and 47% above the low of 1 July 2026.
I am not going to pretend I know where it goes next. What I can do is lay out the forces that are actually measurable — the supply schedule, the miners, the debt, the flows — and say honestly which of them are arguments and which are just facts.
Where we actually stand
The tape, unadorned. $86,231, up 1.3% in 24 hours, 4.2% in a week, 8.4% in a month, 33.4% in two months. Market capitalisation $1.736 trillion, first place, with $24.7 billion traded in the last day. 20,093,556 coins in circulation out of 21,000,000 — 95.7% of the supply already issued.
Then the two numbers that matter more than any of those. Down 30.8% over twelve months. And the Fear & Greed Index at 70 — "Greed".
Bitcoin price, one year of daily closes, with the October 2025 high, the July 2026 low and the current price marked
That combination should make anyone pause. The asset is down a third from its high over the year, and the sentiment gauge reads Greed. Either the gauge is a contradiction, or it is measuring something the twelve-month window hides: a market that has been rising since July and remembers that. Sentiment indices have very short memories. That is what they are for.
A "greed" reading inside a bear year — and why both are true
Here is the honest middle: 36 of the top 50 coins outside bitcoin and stablecoins beat bitcoin over the last 30 days. That is 72% breadth. The conventional threshold for calling an altcoin season is 75%, so we sit just underneath one — but bitcoin dominance is still 59%, and ether is 11.3%. Broad participation without a rotation out of the leader is not a season. It is a market where the rising tide reached everything and the leader lagged it.
That is worth stating plainly because it is inconvenient. Bitcoin is not outperforming. It is participating.
The halving is not a calendar — it is a supply schedule
Right now the chain is at block 969,982. The next halving lands at block 1,050,000. That is 80,018 blocks away, and at ten minutes each, roughly 556 days — call it March 2028.
What the halving actually does is arithmetic on the subsidy: 3.125 BTC per block becomes 1.5625. Daily issuance falls from roughly 450 coins to roughly 225. Measured against the 20.1 million coins already mined, annual issuance drops from 0.82% of the outstanding stock to 0.41% — a halving of a number that was already tiny.
A neat stack of coins with a steel plate pressed down on top so no further coin can be added, one coin glowing orangeA clock face with a single orange hand just past the halfway mark, cutting a pile of coins in half
I keep seeing the halving described as a catalyst. It is better understood as a schedule that everyone knows in advance and nobody can change. That is its real property, and it is precisely the property fiat money does not have. A central bank can announce an intention and then do the opposite three months later; you find out afterwards. The bitcoin issuance path for 2028 has been fixed since 2009, and if a miner or a government dislikes it, there is no committee to lobby.
Whether a known supply cut moves the price is a separate question, and an empirical one. The point that survives is the boring one: the schedule is not the same kind of object as a policy decision.
The miners are the honest tell
If you want one indicator that cannot be faked by sentiment, watch the hashrate. It is the amount of computation the network performs, and it costs electricity, so it responds to economics and nothing else.
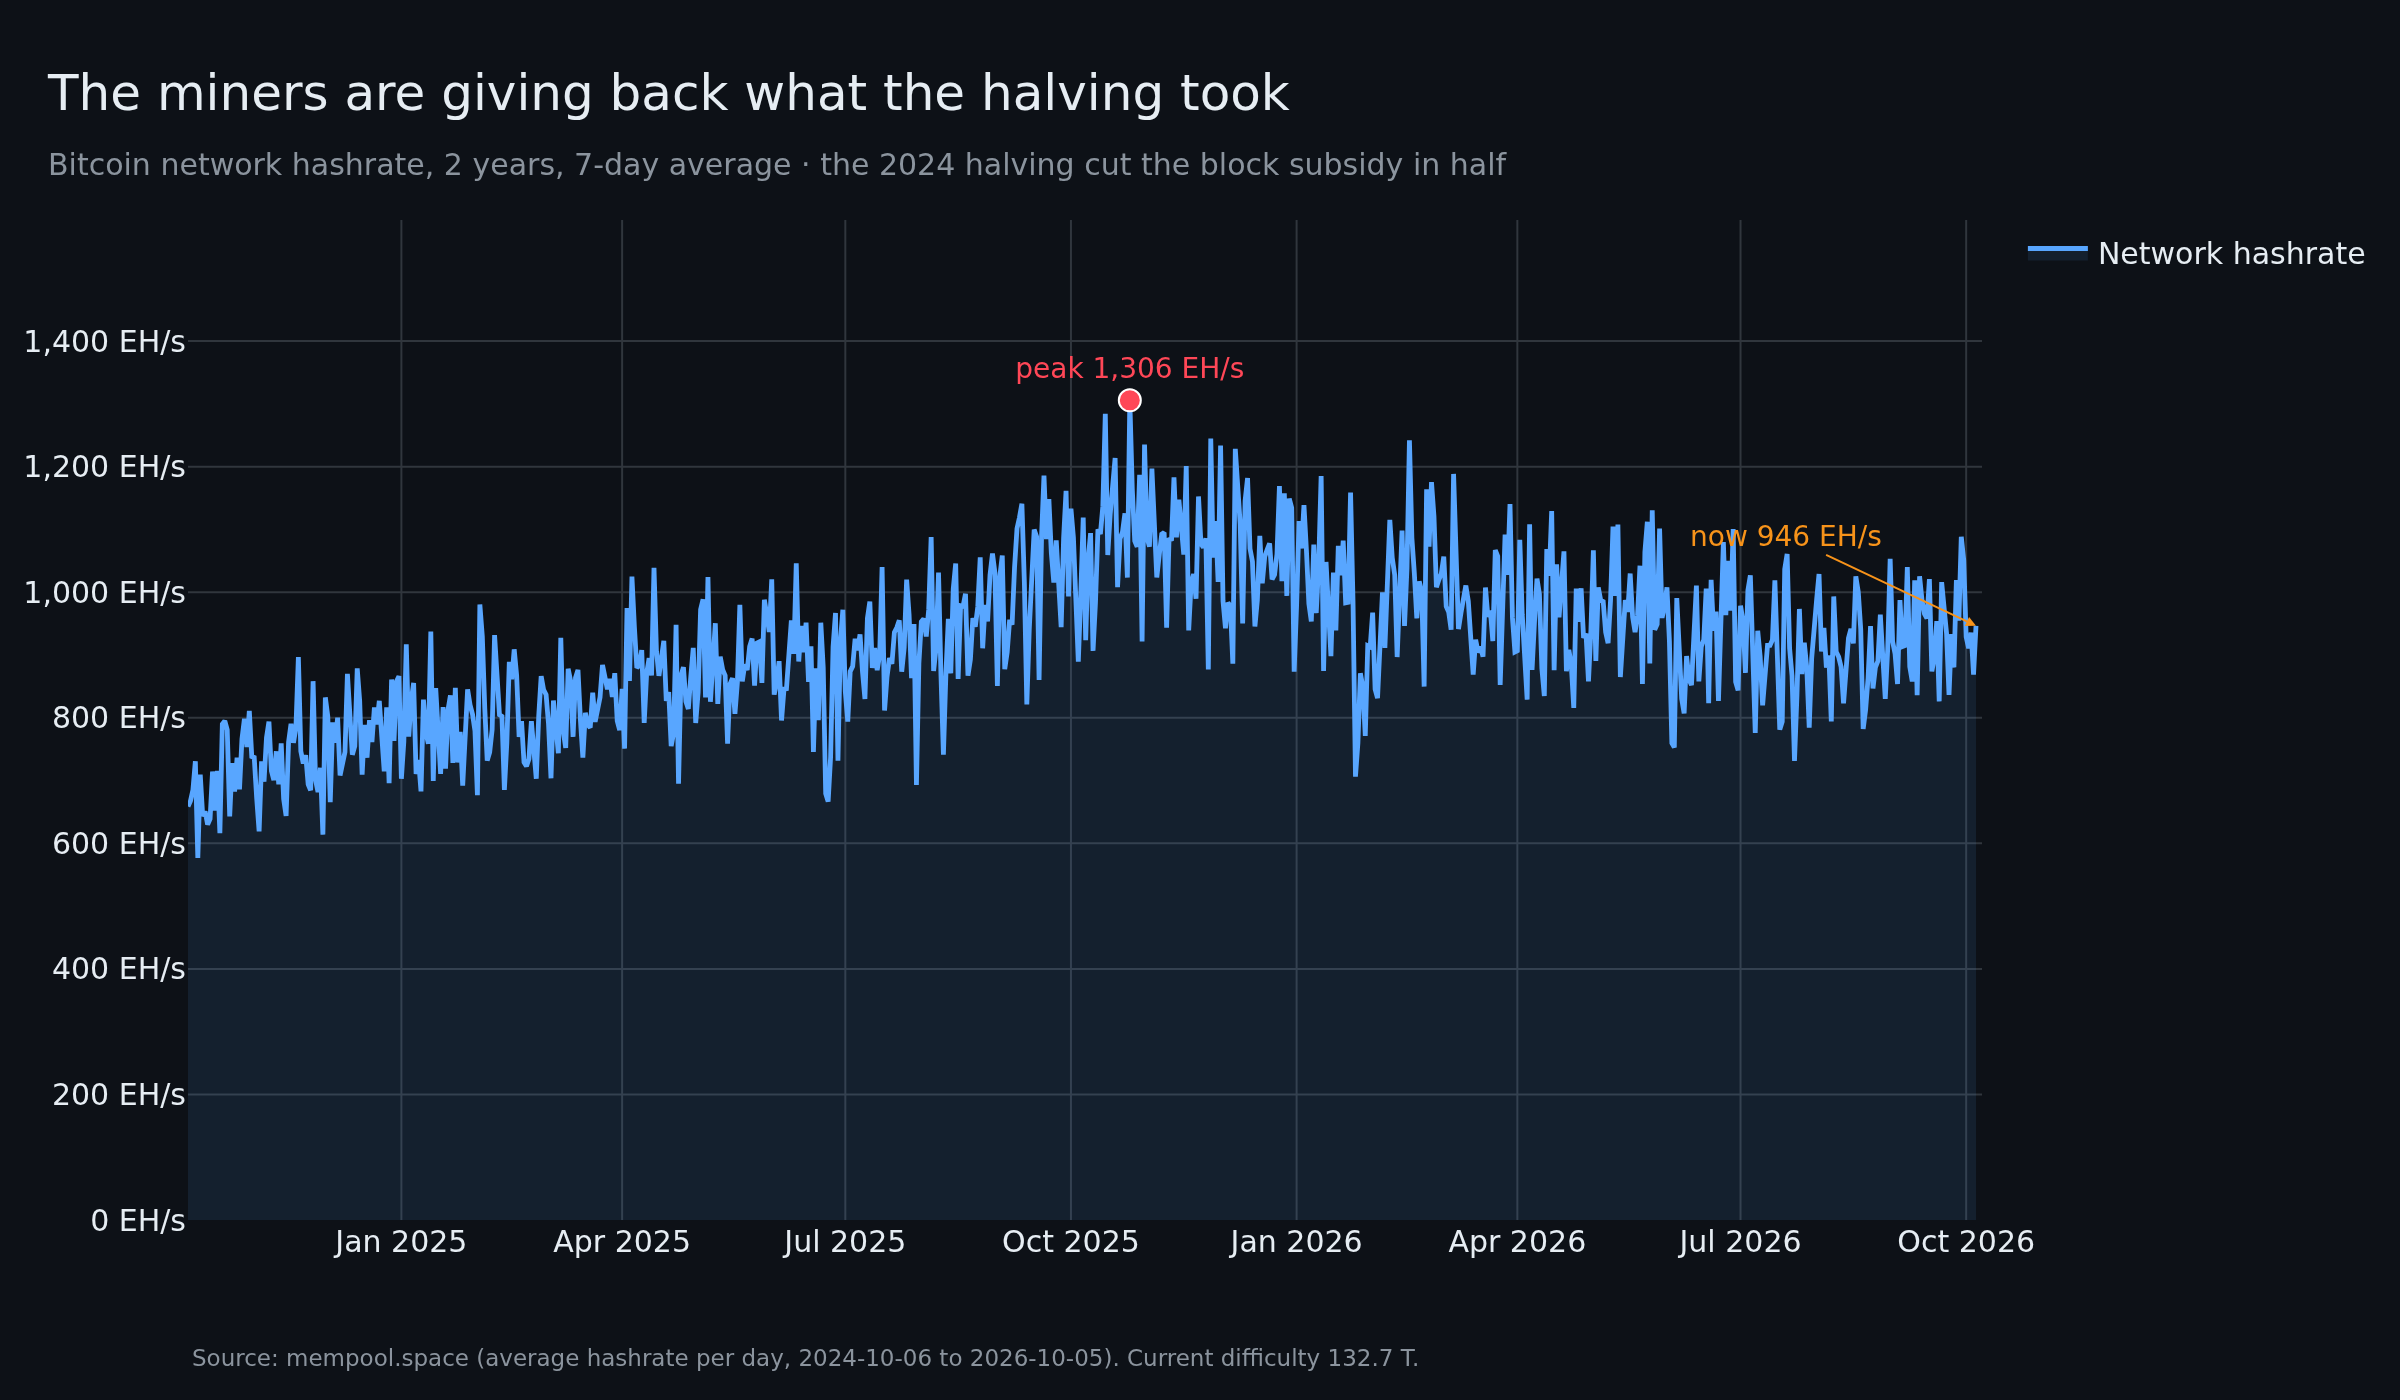
Bitcoin network hashrate over two years, showing the peak above 1,300 EH/s and the current 946 EH/s
The network peaked around 1,306 EH/s on 25 October 2025. It is at 946 EH/s now — 27.5% below the peak. Difficulty is 132.7 trillion. Fees are 1 to 2 satoshis per vbyte, which is to say, effectively nothing.
Read that as an industry responding to a squeeze rather than a machine breaking. The April 2024 halving cut the subsidy from 6.25 to 3.125 coins while the price went on to fall 31% over the subsequent year. Miners whose electricity is expensive cannot print their way through that; they switch off, and the hashrate falls until the remaining operators are profitable again. The network then adjusts the difficulty down and the survivors run cheaper. The cycle already ran once inside this window: the hashrate bottomed at 706 EH/s on 25 January 2026, when sentiment was at its worst, and it has climbed 34% since.
A row of mining rigs where half the frame fades into empty white space, one fan still glowing orange
Anyone arguing that the price must rise because mining is expensive has this backwards. The hashrate is an output of the calculation, not an input. What the falling hashrate tells you is the opposite of bullish narrative: the market's hardest cost input is currently being repriced downward because revenue fell first.
The debt wall is the real macro argument
This is where the Austrian lens earns its keep, because it turns an abstraction into a number you can check.
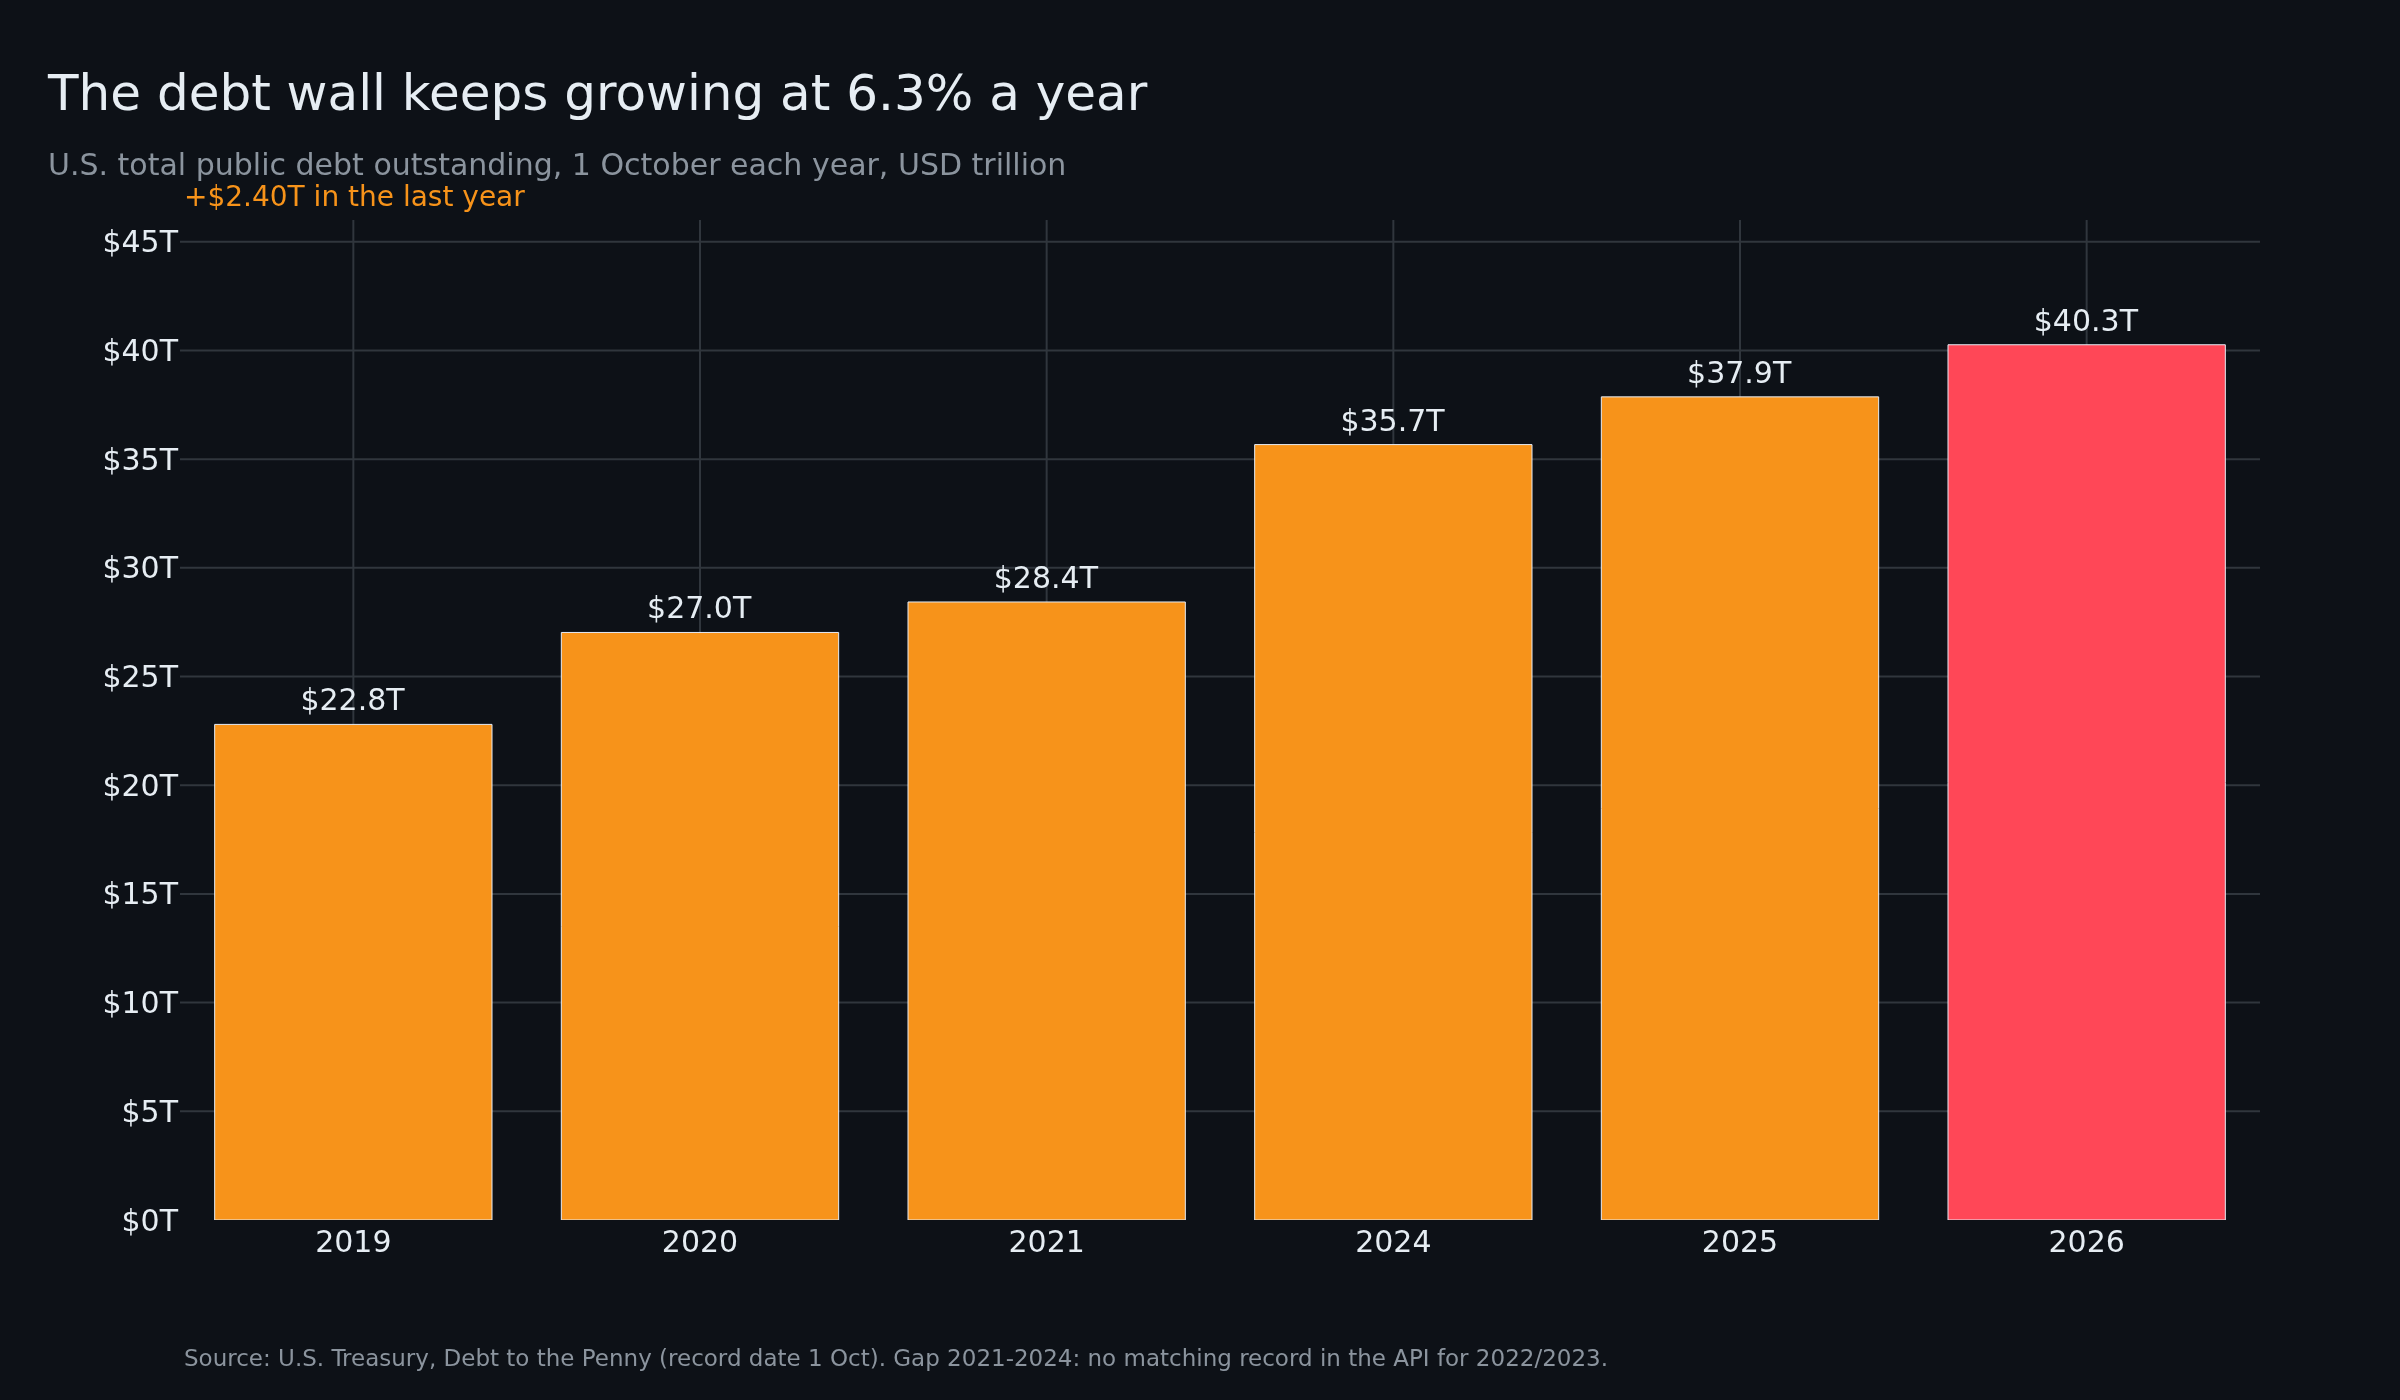
US total public debt outstanding on 1 October of each year, from $22.8 trillion in 2019 to $40.3 trillion in 2026
US total public debt outstanding stands at $40.261 trillion as of 1 October 2026. A year earlier, on 1 October 2025, it was $37.864 trillion. That is +$2.40 trillion in twelve months, a growth rate of 6.3% a year, on a base that is already the largest debt in history. Of the total, $32.434 trillion is held by the public; $7.827 trillion is intragovernmental.
Two ratios make the direction of travel legible. The average interest rate the Treasury pays on its marketable debt is 3.79% on bills, 3.35% on notes, and 3.45% on bonds — as of 31 August 2026. The ten-year yield is 5.25% this morning. So the Treasury is carrying a book at roughly 3.5% while the market demands over 5% for new money. Every refinancing reprices a piece of the stock upward. The debt grows at 6.3% a year; the cost of carrying it is being marked to a rate that nobody who issued that debt expected.
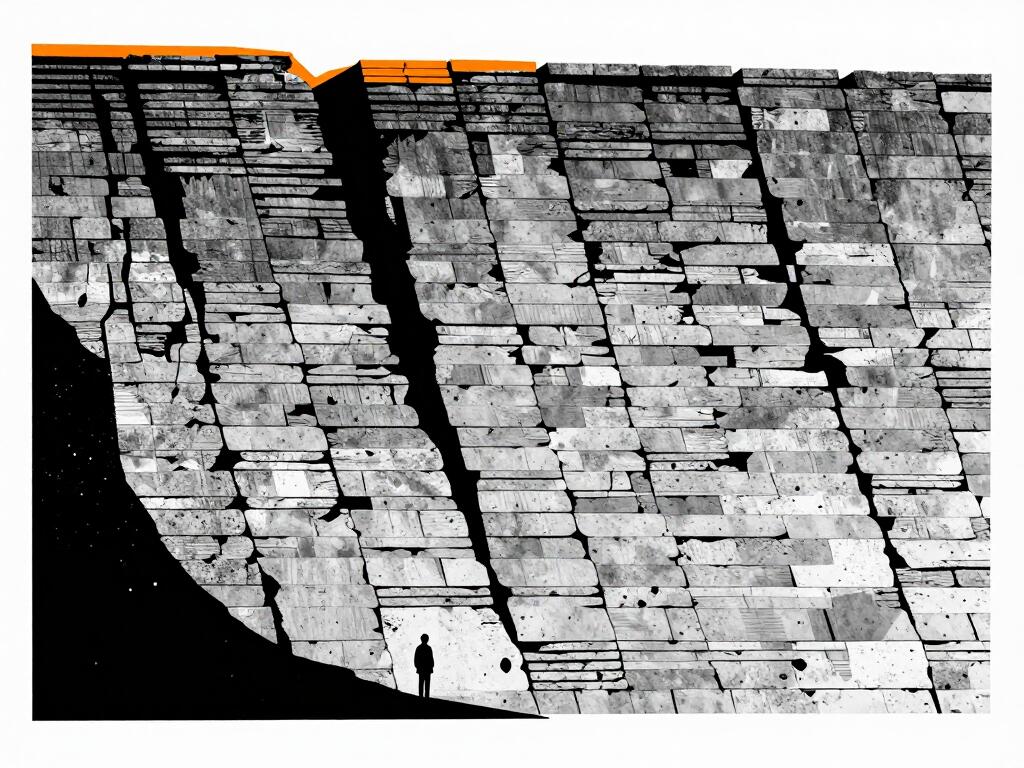
A tiny human figure at the foot of a wall built from thousands of stacked concrete slabs leaning forward above it, with a strip of orange light at the top edge
There are only three ways out of that arithmetic. Grow faster, spend less, or let the unit of account lose value. The first two require politics, and the third requires nobody's permission. That is the entire case for a hard asset, and it does not depend on a chart of past cycles.
Cantillon, in reverse
Richard Cantillon noticed in the 1730s that new money is never neutral. It enters at a specific point, the first recipients spend it before prices have moved, and everyone downstream receives the price rise before the income rise. The path of the money is the policy.
Bitcoin's issuance inverts the mechanism in one specific way worth naming precisely: new coins go to whoever spends the electricity, and the amount is fixed by a schedule no one controls. There is no class of first recipients who receive the new units by proximity to the issuer. The closest thing to a subsidy is the block reward, and it is paid for work performed with real energy, not allocated by discretion.
That is a structural claim, not a price claim. It says something about who captures the seigniorage, not about what the asset is worth next quarter.
The first recipients, this time, are funds
Here is where the last two years diverge from every prior cycle, and the divergence is measurable. US spot bitcoin ETFs recorded a third consecutive week of net inflows at +$241 million, lifting cumulative net inflows to $57.8 billion. Year-to-date net inflows are around $1.2 billion — which tells you how much of the cumulative figure came earlier and how thin this year's flow has been.
The same week, ether ETFs swung to −$138 million outflows after a +$690 million week. Zcash funds posted their first weekly outflow on record at about −$94 million.
A vertical pipe pouring liquid orange metal into three large bowls, with only a few thin drops reaching the crowd holding empty cups far below
The mechanism has a name and it was described in the 1730s, long before there was a central bank to run it. What is new is the direction of the pipe.
Read the numbers together and a picture forms: the ETF complex is a persistent, price-insensitive buyer whose flows do not respond to sentiment the way retail does. It is also a buyer that can leave in the same vehicle it arrived in, and the ether and zcash lines show how fast that can flip. Structural demand and structural supply of sellers are the same pipe.
Time preference, and what a drawdown is for
The Austrian account of interest is not that it is a fee for borrowing. It is an agio on present goods — a measure of how much more we want the thing now than later. When the medium of saving loses value reliably, the rational response is to bring consumption forward. Spend it or watch it rot.
A 31% drawdown is unpleasant, and I am not going to dress it up as healthy. But there is a measurable thing a drawdown does: it separates holders by their time horizon. Someone who bought with borrowed money at the top cannot wait. Someone who bought with savings can. The July low at $58,566 was the price at which the first group finished selling, and the 47% recovery since is what the second group's patience bought.
A single enormous concrete block balanced on one thin cracked pillar, chips already falling away, the load point marked by a thin orange lineTwo open hands side by side — one holding a crumpled banknote dissolving into dust, the other a solid orange coin casting a long shadow
That is not a prediction about the next move. It is an observation about what the move already did.
Thiers' Law beats Gresham's
Gresham's Law — bad money drives out good — is a statement about fixed exchange rates, not a universal truth. On a free market the reverse holds, and the observation goes back to the sixteenth-century Salamanca scholastics: good money drives out bad, because people save what holds value and spend what does not.
Two hands exchanging a crumbling pale coin for a hard solid orange oneTwo hands exchanging a crumbling pale coin for a hard solid orange one
You can watch it negotiated in public. El Salvador received a $138 million IMF disbursement after bitcoin-related waivers were granted — the state modified its bitcoin law to satisfy the lender, in exchange for the money. That is a small country being told, by a balance of payments constraint, to change a monetary statute.
And in the same week, Russia's Finance Ministry paid wages in digital rubles for the first time, and the OKX operator along with the parent of the NYSE filed to launch a tokenized US stock platform. Money is being rebuilt in several directions at once, by states that would each prefer to control it. Where the currency fails, people reach for something that does not need permission to work. It does not have to be bitcoin every time. It has to be something.
Three paths, and no number
I will not give you a target. Anyone who does is selling something. What I can do honestly is describe the conditions.
If the ETF bid holds and the debt arithmetic forces easing: the drawdown is a consolidation inside an uptrend, the 2028 halving arrives into a rising market, and the cycle peak comes late — 2029 rather than 2027. Saifedean Ammous put exactly this shape forward on 2 October: he thinks bitcoin has probably already bottomed, that the next cycle may peak in 2029, and that the price could be around $200,000 by 2030 — adding, in the same breath, "I wouldn't bet on it."
One road splitting into three — one rising to the upper right, one staying flat, one bending into shadow; a small figure with an orange lamp at the fork
If flows stay thin: the year-to-date ETF number — $1.2 billion against $57.8 billion cumulative — is the warning sign. Thin flows with $40 trillion of debt and a 5.25% ten-year means the marginal buyer is not there, and the range holds.
If the miners keep switching off: a persistent hashrate decline is a cost-side repricing. Historically it has coincided with the late part of a bear phase rather than the start of a bull one, which is a reason for patience rather than optimism.
The strongest case against my own argument
I should be fair about this, because the Austrian reading has a blind spot and it is large.
Everything above about the halving, the supply schedule, the debt, and the Cantillon path describes the supply side and the unit-of-account side. None of it describes demand, and price is set by both. A perfectly fixed supply of 21 million units can trade at $10,000 or $500,000 depending entirely on how many people want to hold it, and nothing in the Austrian framework tells you which.
There is a second, sharper objection. Ammous also argued this week that bitcoin treasury companies will struggle to compete with Strategy — which holds 847,666 BTC bought for $63.95 billion — because scale lets it borrow more cheaply. Read what that concedes: a single company now holds about 4.2% of all bitcoin that will ever exist, financed with preferred stock whose dividend had to be raised to 12% when the price fell below $60,000. The asset with no central bank has acquired a small number of very large, leveraged holders whose positions are financed at floating cost. That is a structural fragility the 21-million cap says nothing about, and a hard-money advocate is the one who told us.
Third objection, and it is the one that should sting: the twelve-month return is negative. A store of value that loses 31% of its value in a year has not stored it. The standard answer — that volatility is a feature of the price-discovery phase — is a claim about the future, not a defence of the past.
What I could not verify
I could not find a matching US Treasury record for 1 October 2022 and 2023 in the Debt to the Penny series, so the debt chart has a four-year gap between 2021 and 2024. The numbers on either side of the gap are real; the trend line across it is mine, not the data's.
The altcoin breadth figure — 36 of 50 — is my own calculation from CoinGecko's top-100 by market capitalisation, excluding bitcoin, stablecoins, wrapped tokens and liquid-staking receipts. It is a defensible measure, not the measure, and a different exclusion list would move the number.
And I have no data on who is actually buying at these prices. ETF flows are reported in aggregate, and I have not seen evidence separating new allocations from rebalancing.
The consequence
Nothing above tells you what bitcoin will be worth in 2028. What it does tell you is that the two sides of the trade are structurally asymmetric in one respect only: the supply schedule cannot be changed, and the debt arithmetic cannot be outgrown at 6.3% a year while the market demands 5.25% to lend.
The second of those is not a bitcoin argument. It is a fiat argument. It will be resolved with or without this asset in the room — and if it is resolved the way every previous instance of the same arithmetic was resolved, the resolution will be denominated in the unit of account. That is the only part of this I would defend.
Respect the cycle. Distrust the target. Watch the hashrate, because it cannot lie about cost.