The ten-year hit 5.29 on 30 September, a 2002 level, and 99 of the 110 basis points this year came from the real yield, not from inflation. France now borrows more expensively than Italy, Japanese capital is coming home, and the mortgage rate reached 7.28 percent. The price of capital rose without a crisis, and the fixed-supply asset traded with the Nasdaq through all of it.
2 Oct 20263,735 words · 16 minAlso on Nostr as a long-form note
On 30 September the ten-year Treasury closed at 5.29 percent. To find the last close at or above that level you have to go back to 14 May 2002, when the same instrument yielded 5.32. The thirty-year settled at 5.64. The last time it stood there was 17 December 2001. Two days later, on 1 October, the ten-year gave back five basis points and the thirty-year gave back three.
Cory Klippsten called the ten-year print "its highest yield since 2007." That is understated, and the correction is easy to check. In the whole of 2007 the ten-year never closed above 5.26 percent. The level this market reached is a 2002 level, and the long bond's is a 2001 level. The dot-com bust is not a loose analogy for the current tape. It is the last time these numbers existed at all.
The level is the least interesting part
Take the ten-year apart. The Treasury publishes both a nominal curve and a real curve built from inflation-protected securities, and the difference between them is the breakeven inflation rate, which is what the market will pay to be protected against price increases rather than promised a fixed return.
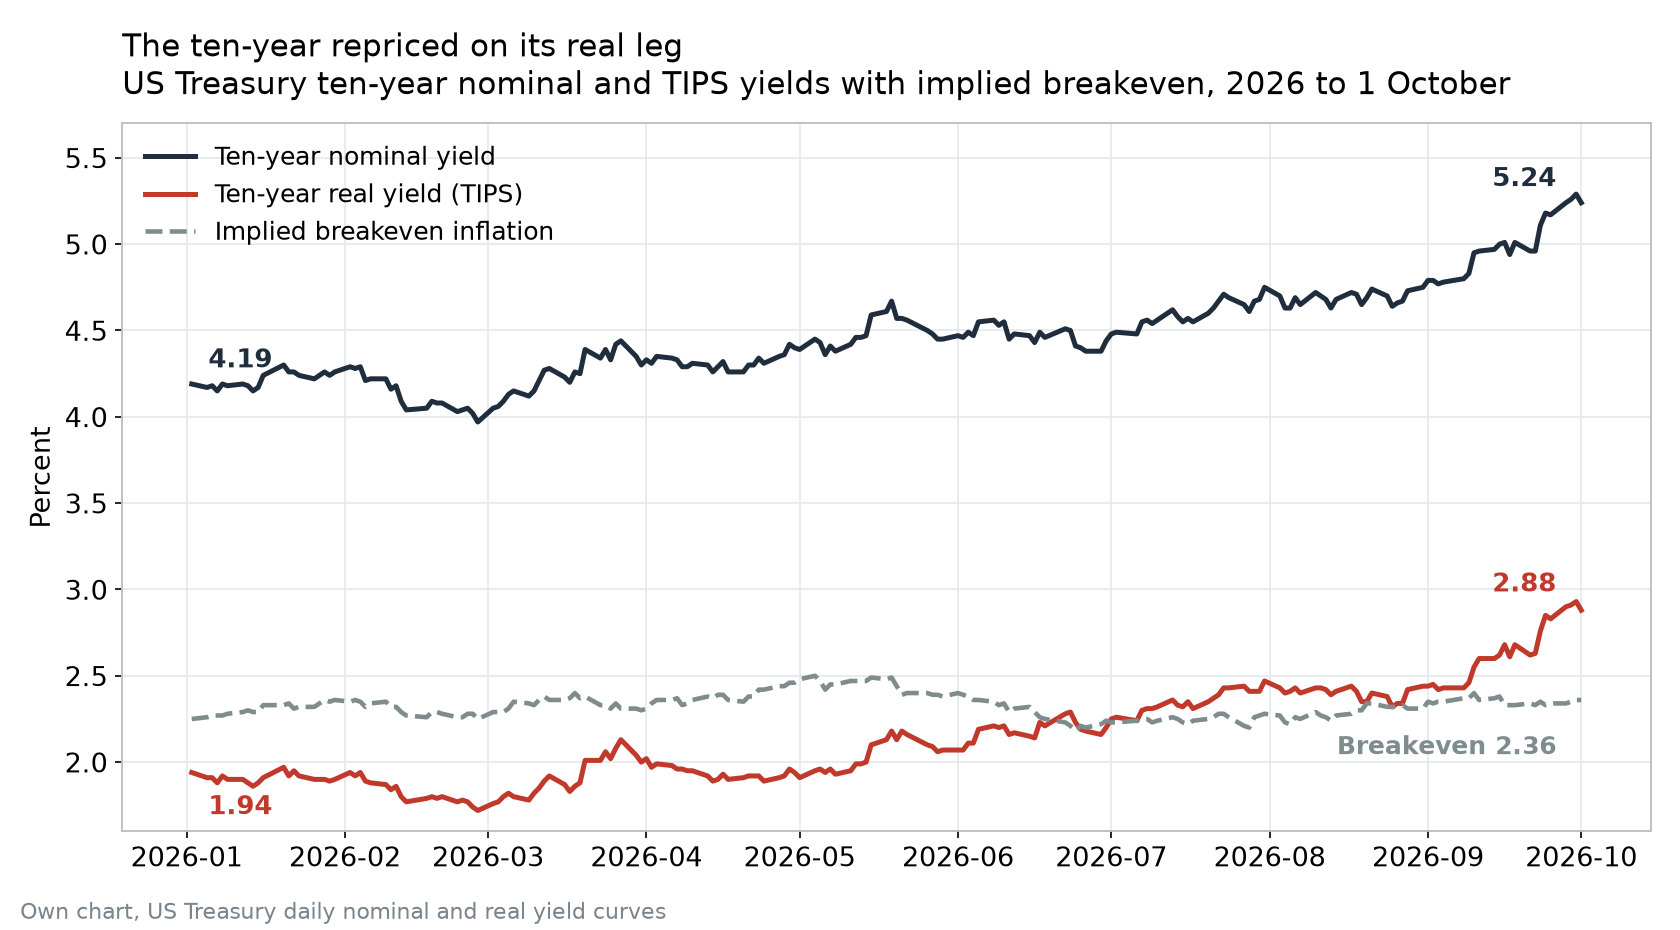
On 2 January 2026 the ten-year sat at 4.19 percent and the real yield at 1.94, implying a breakeven of 2.25. By 30 September the nominal had reached 5.29 and the real 2.93. The breakeven had moved from 2.25 to 2.36. That is 110 basis points of repricing in the nominal rate, of which 99 came from the real yield and 11 from inflation expectations. Nine tenths of the move is not a bet on higher prices. It is a demand for a higher real return on capital.
Chart. The US ten-year Treasury nominal yield, the ten-year real yield from inflation-protected securities, and the implied breakeven inflation rate in percent, daily from 2 January 2026 to 1 October 2026. The nominal line rises from 4.19 to 5.24, the real line from 1.94 to 2.88, and the breakeven stays between 2.25 and 2.36 the whole year. Own chart, data from the US Treasury daily nominal and real yield curves.
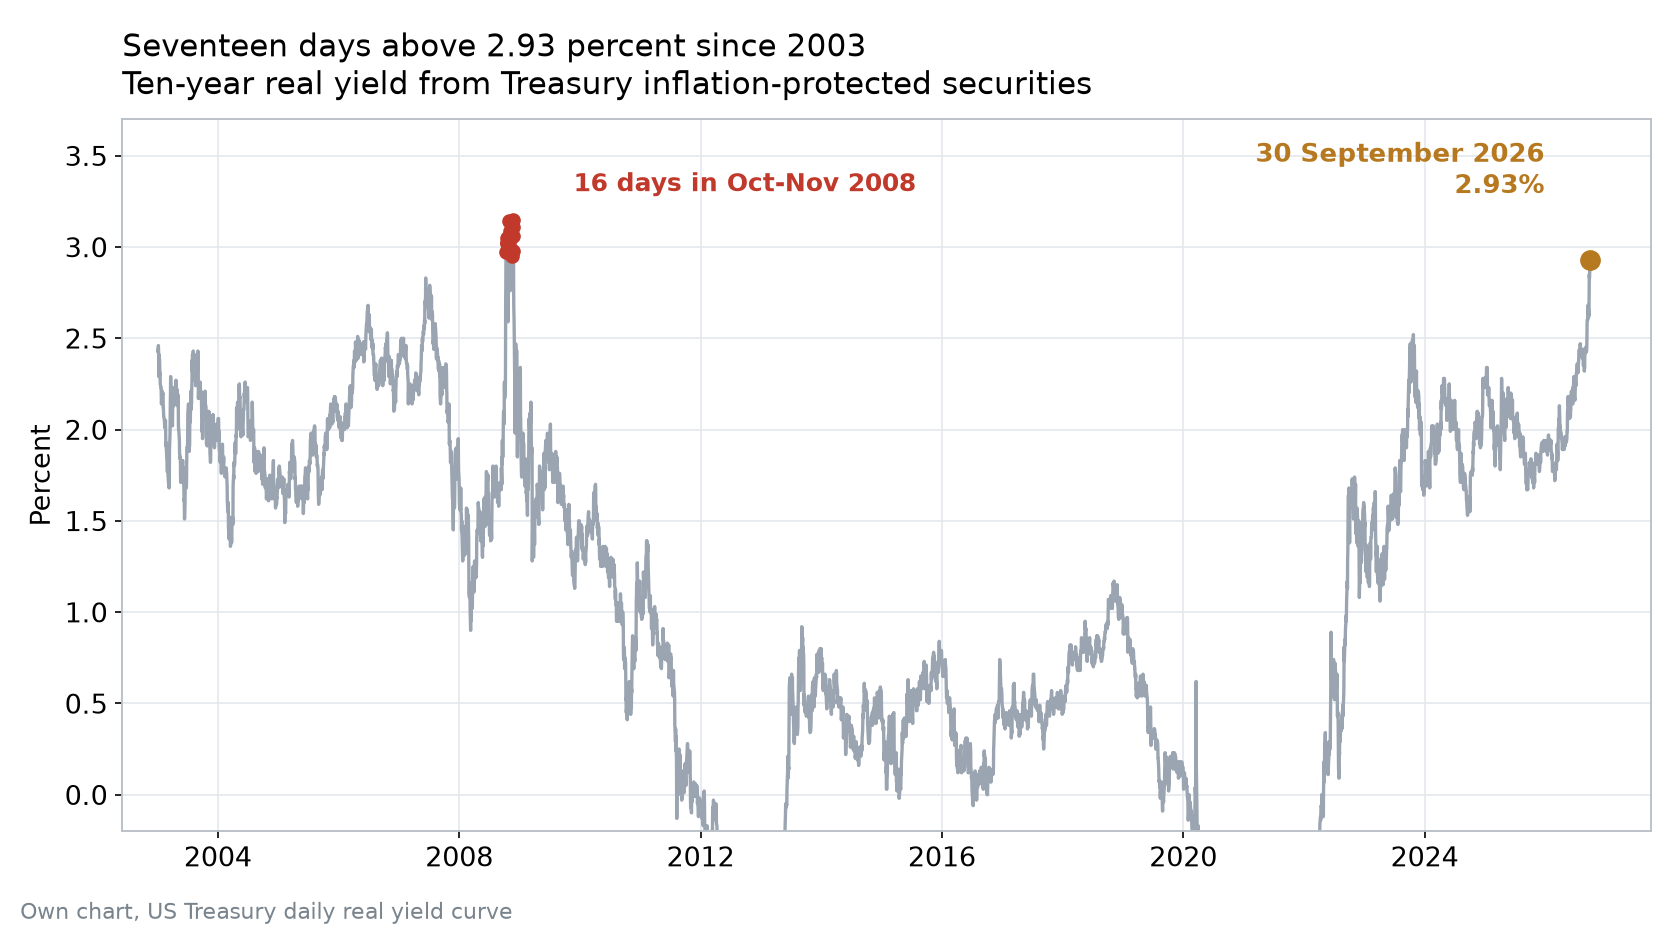
The real yield has a history worth looking at, because the current reading is not merely high for this cycle. In the Treasury's daily real curve, going back to the start of 2003, the ten-year real yield has closed at 2.93 percent or higher on seventeen trading days. Sixteen of them fall between 10 October and 24 November 2008, when the world was discovering that the banking system was insolvent. The seventeenth is 30 September 2026. The series has never been higher than the 3.15 percent it printed on 21 November 2008.
The thirty-year real yield, a series that begins in February 2010, closed on 30 September at 3.33 percent. That is its highest reading in the sixteen years the Treasury has published it. On 1 October it came in at 3.31.
What makes 2026 different from 2008, and this is the part that matters, is what happened to the breakeven at the same time. On 21 November 2008, the day the ten-year real yield peaked at 3.15 percent, the nominal ten-year was 3.20 percent and the breakeven was 0.05 percent. The market was not pricing higher inflation. It was pricing the end of the banking system and a collapse in all nominal claims. By 10 October 2008 the breakeven was still only 0.92.
Today the nominal ten-year is 5.24 percent and the breakeven is 2.36. Inflation expectations have not moved. They have been parked between roughly 2.2 and 2.4 all year, through a war-driven energy shock and a bond rout. The long end has repriced entirely on the real leg, with the inflation leg unchanged. That is the shape of a market that has changed its mind about the scarcity of capital, not about the value of money.
The tell is who is being repriced
A uniform rise in sovereign yields can be explained by a dozen things. What happened in Europe in the last week of September cannot.
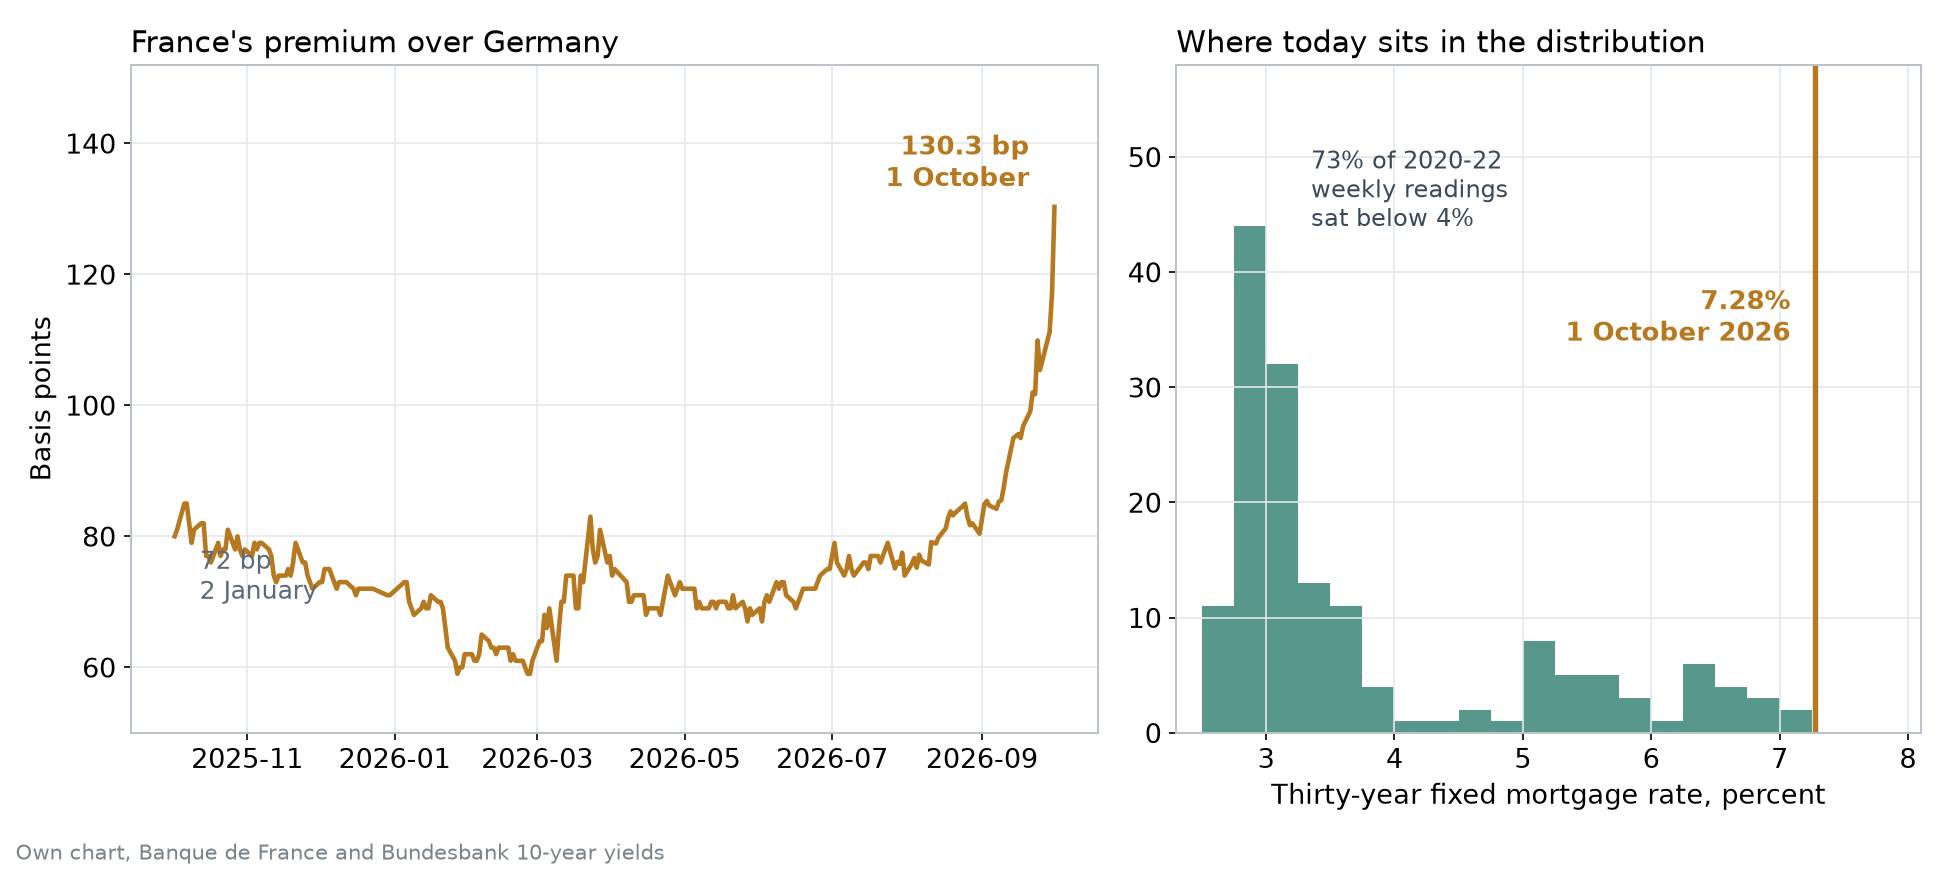
On 1 October the spread between the French ten-year OAT and the German Bund reached 130.3 basis points, up from 117.1 the previous day, 75 at the end of June, and 72 on 2 January. Reuters recorded 132.86 basis points on the same day, its widest since the euro-area debt crisis of 2012. The French ten-year itself printed 4.90 percent on 1 October, a level Trading Economics describes as its highest since July 2002.
The number worth staring at is the one next to it. On 2 October the French ten-year traded at 4.93 percent and the Italian ten-year at 4.70. France borrowed 23 basis points more expensively than Italy. Italy carries more debt relative to its economy and a long history of being priced for it. The ordering has reversed, and the market is not ranking the two by debt level. It is ranking them by the credibility of the plan to service it.
Chart. Two panels. Left: the spread between the French ten-year OAT and the German ten-year Bund in basis points from 2 October 2025 to 1 October 2026, rising from 80 to 130.3 with most of the move in the final month. Right: a histogram of the Freddie Mac thirty-year fixed mortgage rate for all of 2020 to 2022, showing that 73 percent of those weekly readings sat below 4 percent, with a vertical line at 7.28 percent for 1 October 2026. Own charts, data from Banque de France, Bundesbank and Freddie Mac.
The other end of the same story is Japan. The Japanese ten-year yielded 3.097 percent on 2 October. Against the American ten-year at 5.25 that leaves a spread of 215 basis points. A Japanese institution lending to the US government earns that spread over its own funding cost [own subtraction of two published yields]. It does so before hedging a currency risk that used to be a rounding error and no longer is. British gilts paid 5.37 percent, more than Treasuries.
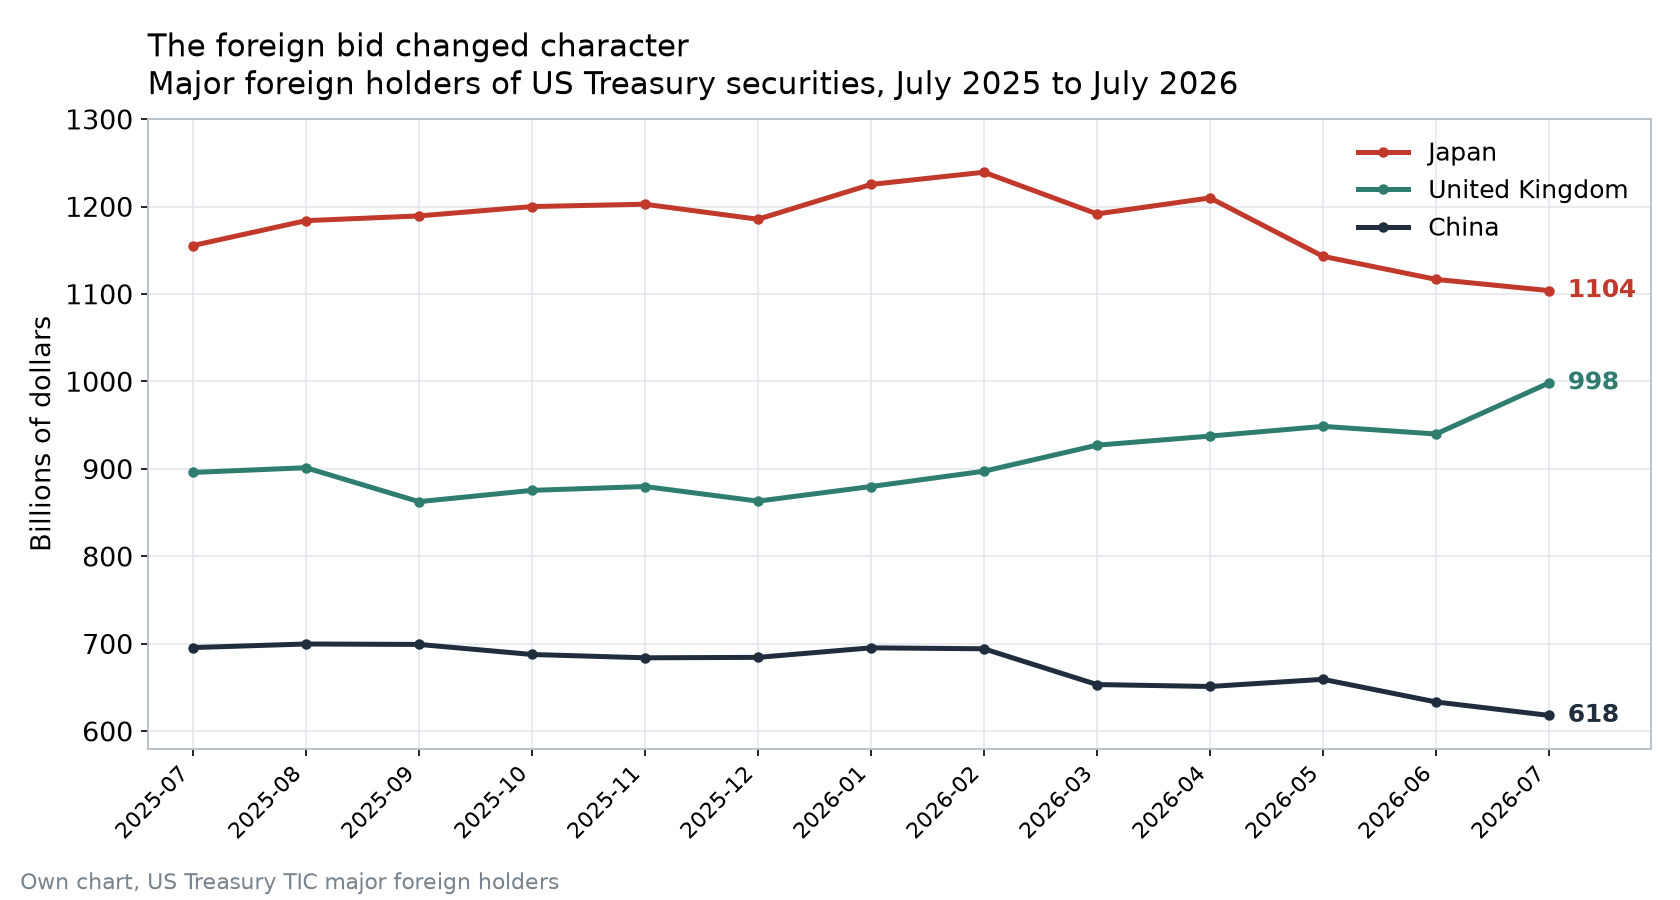
The mechanical consequence shows up in the official custody data. Treasury International Capital Table 5 puts Japanese holdings of US securities at 1,239.3 billion dollars in February 2026 and 1,103.9 billion in July. That is 135 billion dollars withdrawn in five months, the fastest sustained reduction in the series. Chinese holdings fell from 695.6 billion in July 2025 to 618.0 in July 2026. British holdings rose over the same thirteen months from 895.9 to 998.3.
Read those three lines together and you get a change in the character of the foreign bid, not just its size. A reserve manager buys Treasuries because a committee decided to hold reserves in dollars. A private balance sheet buys them because the yield covers the funding cost and the currency risk. The first buyer is slow, indifferent to price, and politically motivated. The second is fast, price-sensitive, and leaves when the trade stops working. The share of the bid coming from balance sheets rather than committees has been rising for two years. That is a different kind of buyer, and it is a different kind of market.
Chart. Major foreign holders of US Treasury securities in billions of dollars, July 2025 to July 2026. Japan falls from 1,155 to 1,104, the United Kingdom rises from 896 to 998, and China falls from 696 to 618. Own chart, US Treasury TIC major foreign holders.
The escape hatch, stated as well as it can be
There is a serious argument that runs against everything above, and it deserves its strongest form rather than a straw man.
Jordi Visser makes it in his paper on tokenization. The monetary identity is M times V equals P times Y, money times velocity equals nominal activity. Almost the entire public debate treats M as the only movable piece, which is why every debt discussion collapses into a prediction about the printing press. Visser's claim is that the movable piece is V. American households and nonprofits held 195.9 trillion dollars of net worth in the second quarter of 2026, according to the Federal Reserve's Financial Accounts, supported by 217.8 trillion of gross assets, against roughly 40 trillion of federal debt. That wealth exists. Its problem is friction: a house is worth two million dollars on paper and ten thousand dollars in a checking account, and the distance between those two facts is underwriting, documentation, settlement and time.
Tokenization and machine-speed agents shorten that distance. Collateral can be monitored continuously, fractional interests can be pledged, and an agent does not wait for Monday morning or a settlement window. Visser's arithmetic is straightforward: more operating hours and less friction means more economic throughput from the same stock of capital. Velocity rises without a single new dollar being printed, and the debt becomes easier to carry without anyone having to monetize it.
His supporting evidence is not weak either. Visser also cites a Federal Reserve note published on 4 September 2026 on new forms of money and the monetary aggregates. Its working definition of money — safe assets with stable values that households and businesses can use to pay or to hold short term — is a functional definition, not an institutional one. Anything that performs the function qualifies. That is a central bank explicitly leaving the door open for the definition of money to migrate toward whatever technology makes most liquid.
I think the mechanism is real and I think the conclusion is partly wrong, in a way that matters for anyone reading this with a mortgage.
Tokenization raises the velocity of collateral. It does not raise the solvency of the borrower. If the two million dollar house becomes easier to borrow against, its owner gains liquidity and its price support strengthens. The person who does not own the house gains nothing from the improvement except a higher floor under the asset they were trying to buy. Visser's mechanism is a story about the asset side of the national balance sheet. The interest bill is on the liability side, and the liability side is serviced with flows, not with collateral. Making wealth more mobile makes wealth more valuable. It does not create the income stream that pays a 7.28 percent mortgage.
What the price of capital does at street level
That number, 7.28 percent, is where the abstract part ends.
Freddie Mac's Primary Mortgage Market Survey recorded the thirty-year fixed at 7.28 percent on 1 October, the highest reading since 22 November 2023 and up from 6.71 on 3 September. That is 57 basis points in four weeks, in a month when the ten-year moved less than the mortgage did.
The relevant statistic is not the level but the share of history the level excludes. Freddie Mac's weekly series runs from April 1971. Of the 2,897 weekly observations since then, 363 — twelve and a half percent — have been below 4 percent. Split that differently: between 2020 and 2022, 73.2 percent of all weekly readings were below 4 percent, and the series low of 2.65 percent was printed on 7 January 2021. A borrower who took a mortgage in that window did not take a slightly better deal than today's. They took a rate 463 basis points below today's, and they are now structurally unable to sell.
Run the payment on a 400,000 dollar loan. At 3.35 percent it is 1,763 dollars a month in principal and interest. At 7.28 percent it is 2,737 [own calculation, standard amortisation, 360 months]. That is 974 dollars a month, or 11,688 dollars a year, for the same house at the same price. The ratio between the two payments is 1.55.
Chart. The ten-year real yield from US inflation-protected securities in percent, daily from January 2003 to 1 October 2026. The series never exceeded 2.93 percent except for sixteen days between 10 October and 24 November 2008, and once on 30 September 2026, both marked. Own chart, US Treasury daily real yield curve.
The consequence is already in the transaction data. Existing-home sales in August ran at a seasonally adjusted annual rate of 3.98 million, down 2.0 percent month over month and 1.2 percent year over year, per the National Association of Realtors. The median existing-home price was 429,100 dollars, up 1.6 percent on the year. Inventory was 1.62 million units, 4.9 months of supply. Prices rose while volumes fell, which is exactly what happens when the supply of homes for sale is throttled by owners who cannot afford to lose their old mortgage and the demand is limited by buyers who cannot afford a new one.
Marty Bent's reporting on this is precise in a way worth preserving. The freeze is not uniform. At the high end buyers arrive with 20 and 30 percent down payments in cash. Below roughly half a million dollars, the mortgage-dependent market has stopped. A seller holding a 3.35 percent loan and a sub-1,000 dollar monthly payment who lists into a 7.28 percent market is being asked to trade that payment for one north of 2,500 dollars on the same balance. Most cannot, so they hold, and the constraint propagates. The bond market's repricing did not arrive as a crisis. It arrived as a for-sale sign with no showings.
The layer that is not priced at all
There is a second repricing happening in the same weeks, and it does not appear in any yield.
On 2 October the Core Lightning team told operators running version 26.06.7 or earlier to upgrade immediately, citing reports of attackers actively targeting unpatched nodes. The patch had been public for ten days. Version 26.06.8 was published on 22 September and its changelog is not a list of cosmetic fixes. Among the entries are three classes. An unauthenticated request to the REST interface using YAML anchors and aliases could exhaust memory and crash the plugin. A peer receiving a payment could crash the sender's node by returning a crafted error onion. And a unilateral close after a splice could broadcast a revoked commitment state, handing the channel balance to the counterparty's penalty mechanism. That last item is a fund-loss bug.
That last item is a fund-loss bug, closed quietly, with the source released immediately and no embargo. The team also stated that it deliberately withheld some test details to slow down reverse engineering by attackers.
Now line up the dates. On 28 August the project shipped 26.06.7, and its release notes say plainly that the release came at a time when increasingly capable AI models are being used to find vulnerabilities in open-source code, increasing the volume and pace of security reports. That release carried a fourteen-day embargo. It also carried a documented failure: between 28 August and 1 September, the Docker tags for that version served images that reported the new version number on startup but did not contain the fixes, published automatically by a continuous-integration job from a placeholder tag. Twenty-five days after the release, a follow-up patch for three further bug classes. Ten days after that follow-up, reports of exploitation in the wild.
The compression is the story. Vulnerability discovery that used to take a research team months now takes a scanning tool days, and the same tooling works for the attacker's side of the exchange. The defensive advantage of a private embargo — the window in which the patch exists and the exploit does not — is shrinking, because the patch itself is machine-readable. Core Lightning's own remedy was to withhold tests, which is an admission that the embargo no longer does the job alone. Meanwhile LND shipped v0.21.4-beta and v0.20.5-beta on 1 October, the same week.
Nobody's model of sovereign debt includes this. But it belongs in the same piece, because it is the same variable. The price of capital rose because lenders decided the old return was wrong. The price of operational credibility fell in the same month, for the same underlying reason: a change in what machines can do, applied simultaneously to a market's supply of credit and to an open-source project's attack surface.
The fixed-supply asset did not answer
This is the uncomfortable section, and I am writing it because the alternative is to write the piece everyone already expects.
Bitcoin's all-time high was 126,200 dollars, on 6 October 2025. As I write, on 2 October 2026, it trades at 85,820, which is 32 percent below that high and 3.4 percent below where it began the year. It closed 2026's first day at 88,839 and its low was 57,800 on 1 July.
Now set that against the bond move. Between 30 June and 30 September the ten-year nominal went from 4.44 to 5.29 and the real ten-year from 2.20 to 2.93 — the sharpest single-quarter repricing of real long rates in the available data. Over those same three months, Bitcoin went from 58,625 to 83,624. Real yields rose 73 basis points and Bitcoin rose 43 percent.
That is not what the thesis predicts. I measured the weekly relationship directly: taking Friday closes from January through September 2026 and the corresponding ten-year real yield, the correlation is minus 0.085. Almost nothing. From July through September it is plus 0.72 — rising real yields with a rising Bitcoin, which is the inverse of the mechanism people describe. The earlier half of the year gives minus 0.28 [own calculation, 39 weekly observations].
The mechanism that fits the tape better is duration. Bitcoin has no cash flows today and its entire value sits in a terminal state. That makes it the longest-duration asset in any portfolio, and duration is what a rise in the discount rate is supposed to hurt. Scarcity asserts itself only when the repricing is about the currency rather than about the real return on capital. A quarter in which 99 of 110 basis points came from the real yield is a repricing of capital. It is not a vote of no confidence in the dollar. The breakeven at 2.36 percent says so explicitly.
Klippsten's conclusion that a stress in the debt-based system gives people another reason to ask whether they want their wealth tied to governments is directionally fair over a decade. Over a quarter in which real rates moved and nothing broke, it is simply not what the price did.
What I could not verify, and the strongest case against me
Two of the newsletter items I am carrying second-hand. Marty Bent's disability piece leans on Ed Dowd's reading of the Current Population Survey — 37,029,000 Americans reporting a disability in July 2026 against a pre-2021 plateau — and on the Phinance Technologies body-system dashboard. I could not verify either at source; the Bureau of Labor Statistics blocks automated retrieval. The UK half of that story I did check: the Department for Work and Pensions reported 4.1 million PIP claimants in England and Wales as of July 2026, and that is a figure I can stand behind. The American half is a claim, not a measurement, and I am labelling it as one.
On France, the record 340 billion euro borrowing figure circulating in the press is for 2027, not 2026. Agence France Trésor's own page states the 2026 medium- and long-term issuance programme, net of buybacks, at 310.0 billion euros, with 85 percent completed by the end of September.
Now the case against my own framing, which is substantial.
The term premium is not elevated. The Federal Reserve's ACM estimate put the ten-year term premium at 85 basis points on 29 September — roughly double the 2021 trough, and well below the 1.40 percent it reached in 2014. A real ten-year yield near 2.9 percent is close to what a 2 percent inflation target plus 2 to 3 percent trend real growth arithmetically implies. On that reading, 2026 is not a dislocation at all. It is the removal of a distortion created by a decade of quantitative easing and financial repression, and the correct word is normalisation.
The curve supports that reading, and it contradicts the horsemen framing. The two-year is at 4.78 percent against a federal funds target range of 3.75 to 4.00 percent, which the Federal Open Market Committee raised by 25 basis points on 17 September, after cutting in October and December 2025. The 2s10s spread has narrowed from 72 basis points on 2 January to 46 on 1 October. The curve is flattening into a tightening cycle with an anchored front end. That is a different object from a curve steepening because investors are dumping duration, and it is not what the end-of-the-world trade looks like.
And the custody data is weaker evidence than its precision suggests. TIC holdings are reported by custodians, and a position booked to Belgium or the Cayman Islands is frequently owned somewhere else entirely. Japan reducing its line item is a fact about a reporting geography as much as about a decision in Tokyo. I used the series and I want the caveat attached to the same page.
The asymmetry worth carrying
Here is what I think actually happened this quarter, stated as narrowly as the evidence allows.
A repricing of the real cost of long-term capital occurred, driven by the withdrawal of price-insensitive buyers and by a genuine and durable global shift in where capital is willing to sit. That repricing raised the cost of the one form of leverage most households use, in the same quarter in which it raised the cost of the one form of leverage most governments use. It did so without a failed auction, a default scare, a bank failure or a crisis mechanism of any kind. Nothing broke. The market simply decided the old price was wrong, and the price changed.
The escape hatch — that technology will lift velocity enough to make the debt serviceable — is a real argument about the stock of wealth. It is not an argument about the flow of income needed to service a fixed obligation. And the same technological shift that is supposed to lift velocity has already compressed the window between a vulnerability being found and being used, on the operational layer that the entire cryptocurrency system runs on.
The asset with the fixed supply spent the quarter trading with the Nasdaq. That is not a refutation of its long-term case. It is a precise statement about what it is priced as today, and about which repricing this actually is.