The Bond Market Is Not 2007. It's Worse.
The 30-year Treasury at 5.37% has passed the 2007 peak, but the curve, the debt load and the mechanism are entirely different. What financial repression does to savers, and what it means for Bitcoin.
The 30-year Treasury at 5.37% has passed the 2007 peak, but the curve, the debt load and the mechanism are entirely different. What financial repression does to savers, and what it means for Bitcoin.
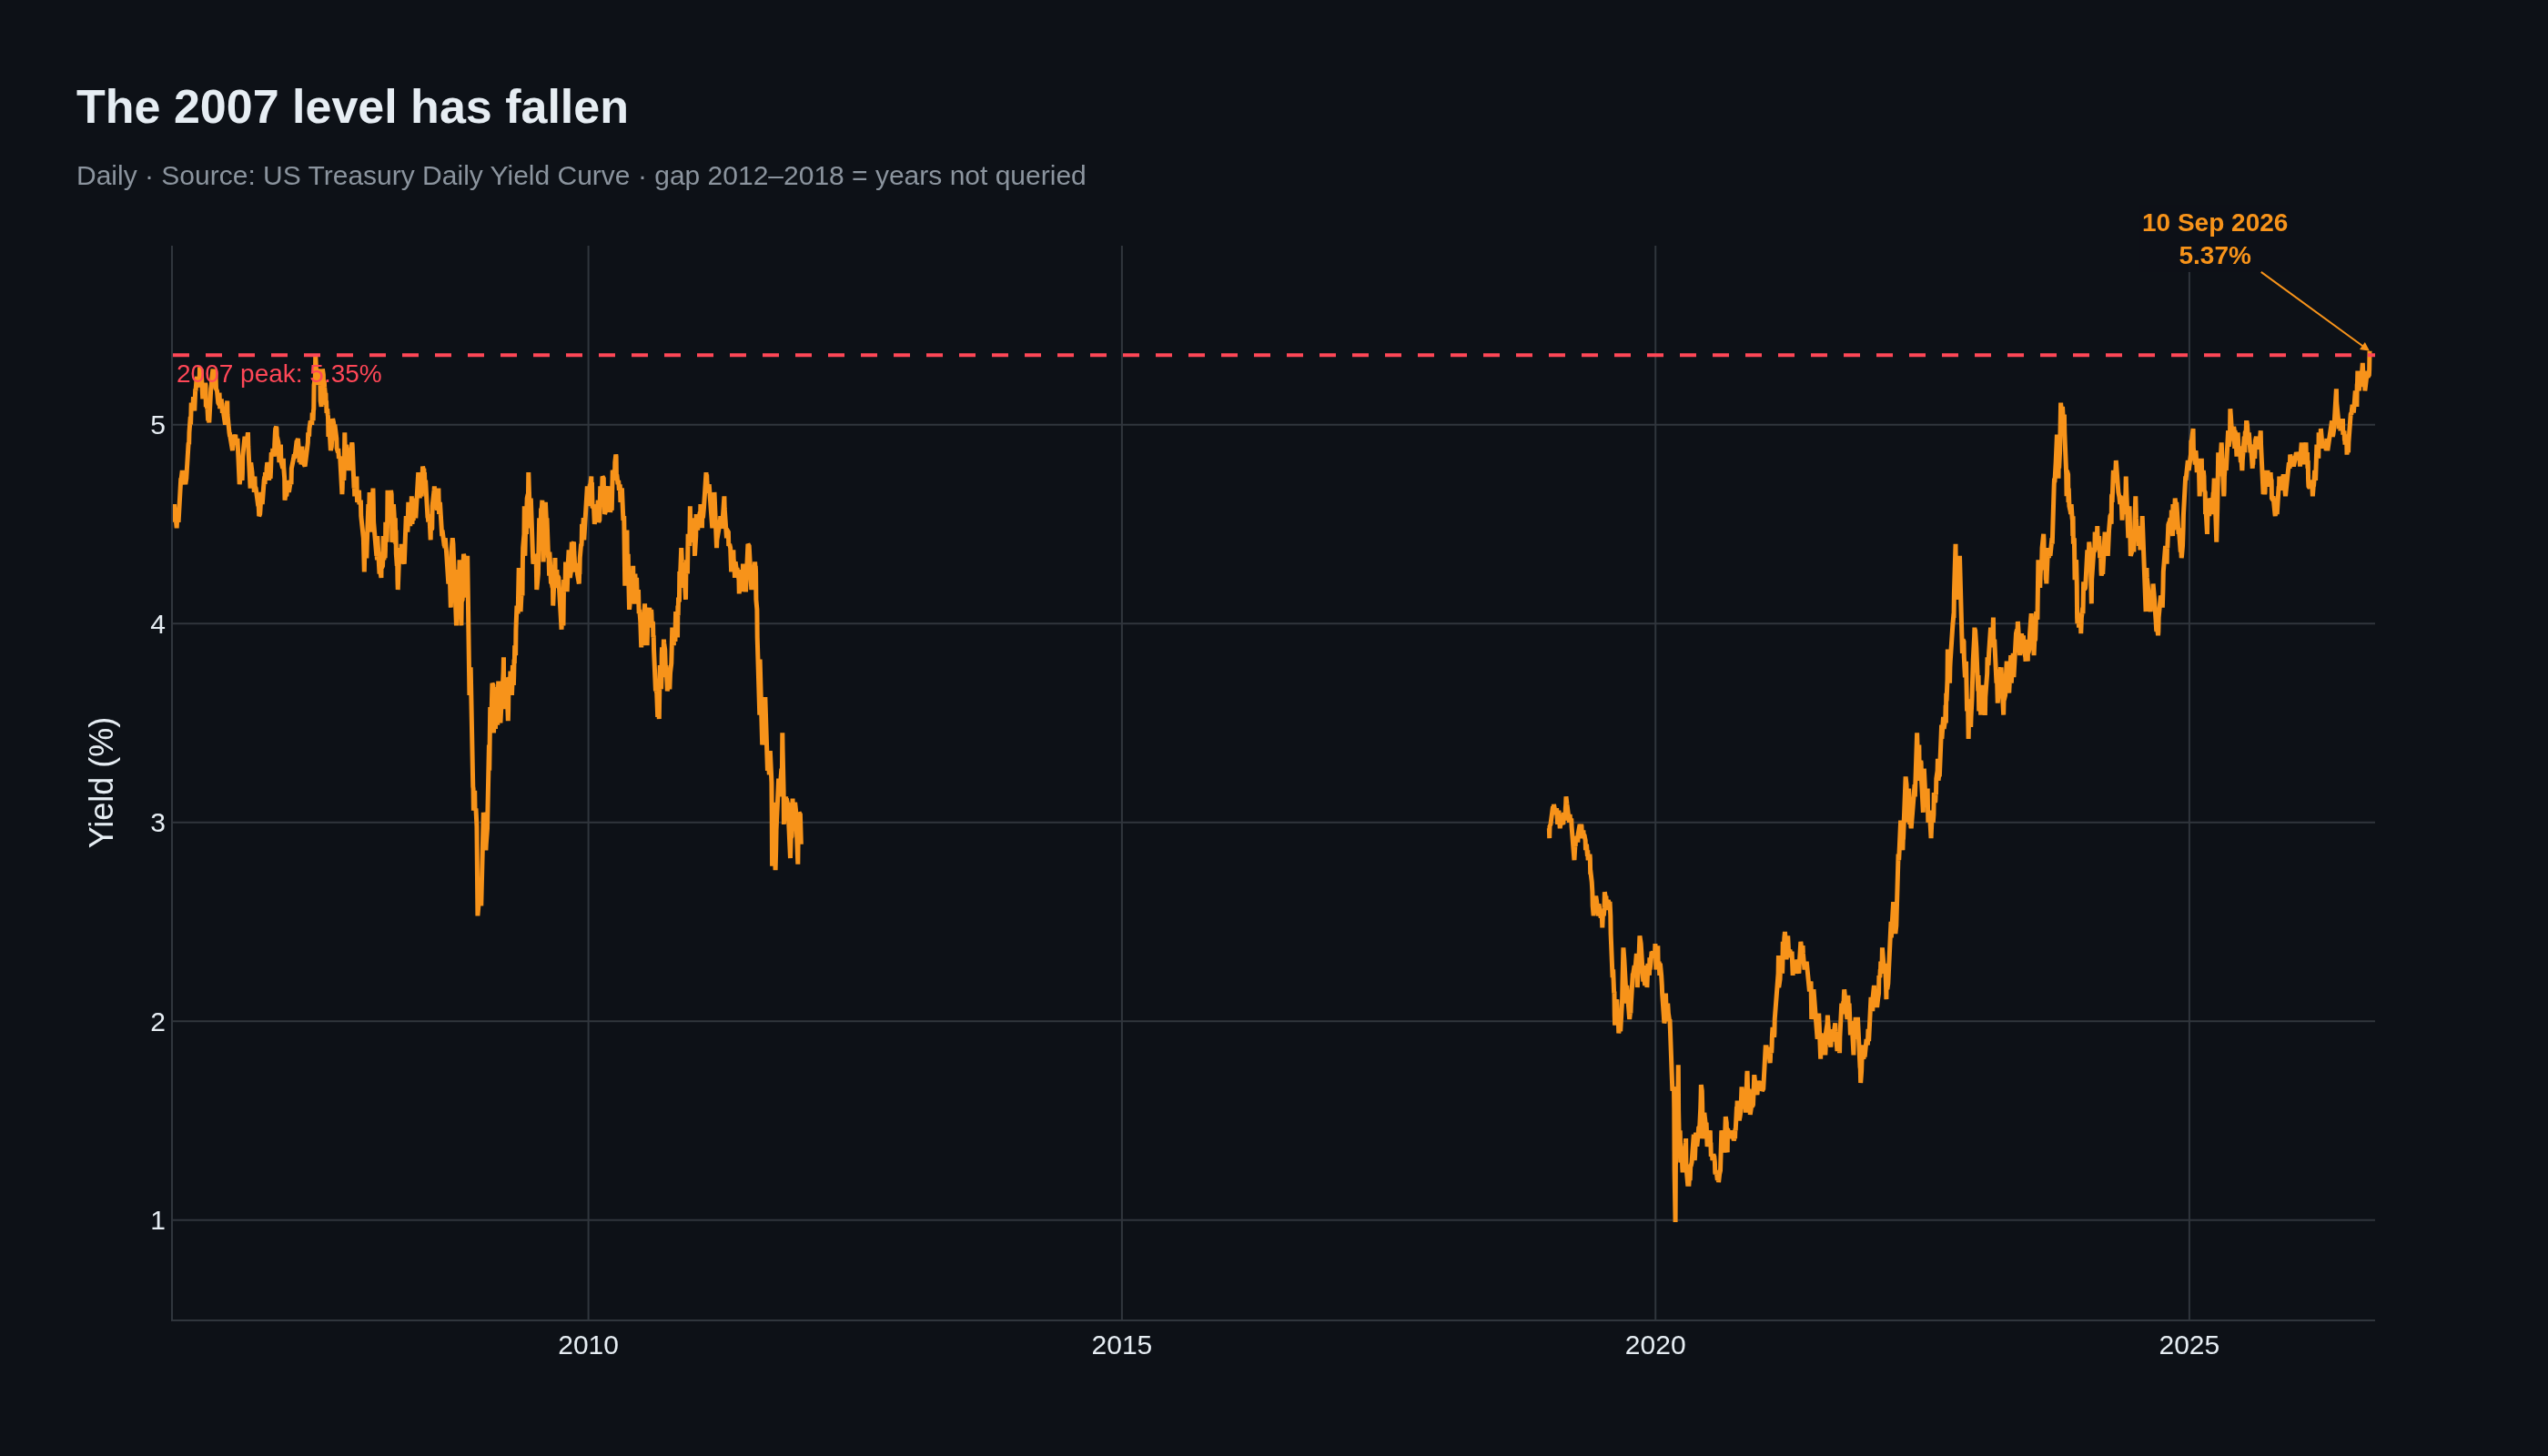
On 10 September the 30-year US Treasury closed at 5.37%.
The last time it stood there was 12 June 2007. Three months later the credit market froze.
That comparison has run through every financial desk for weeks. It is convenient, it is dramatic, and it leads you somewhere wrong. Because 2007 and 2026 have almost nothing in common except a number, and the difference is the entire story.
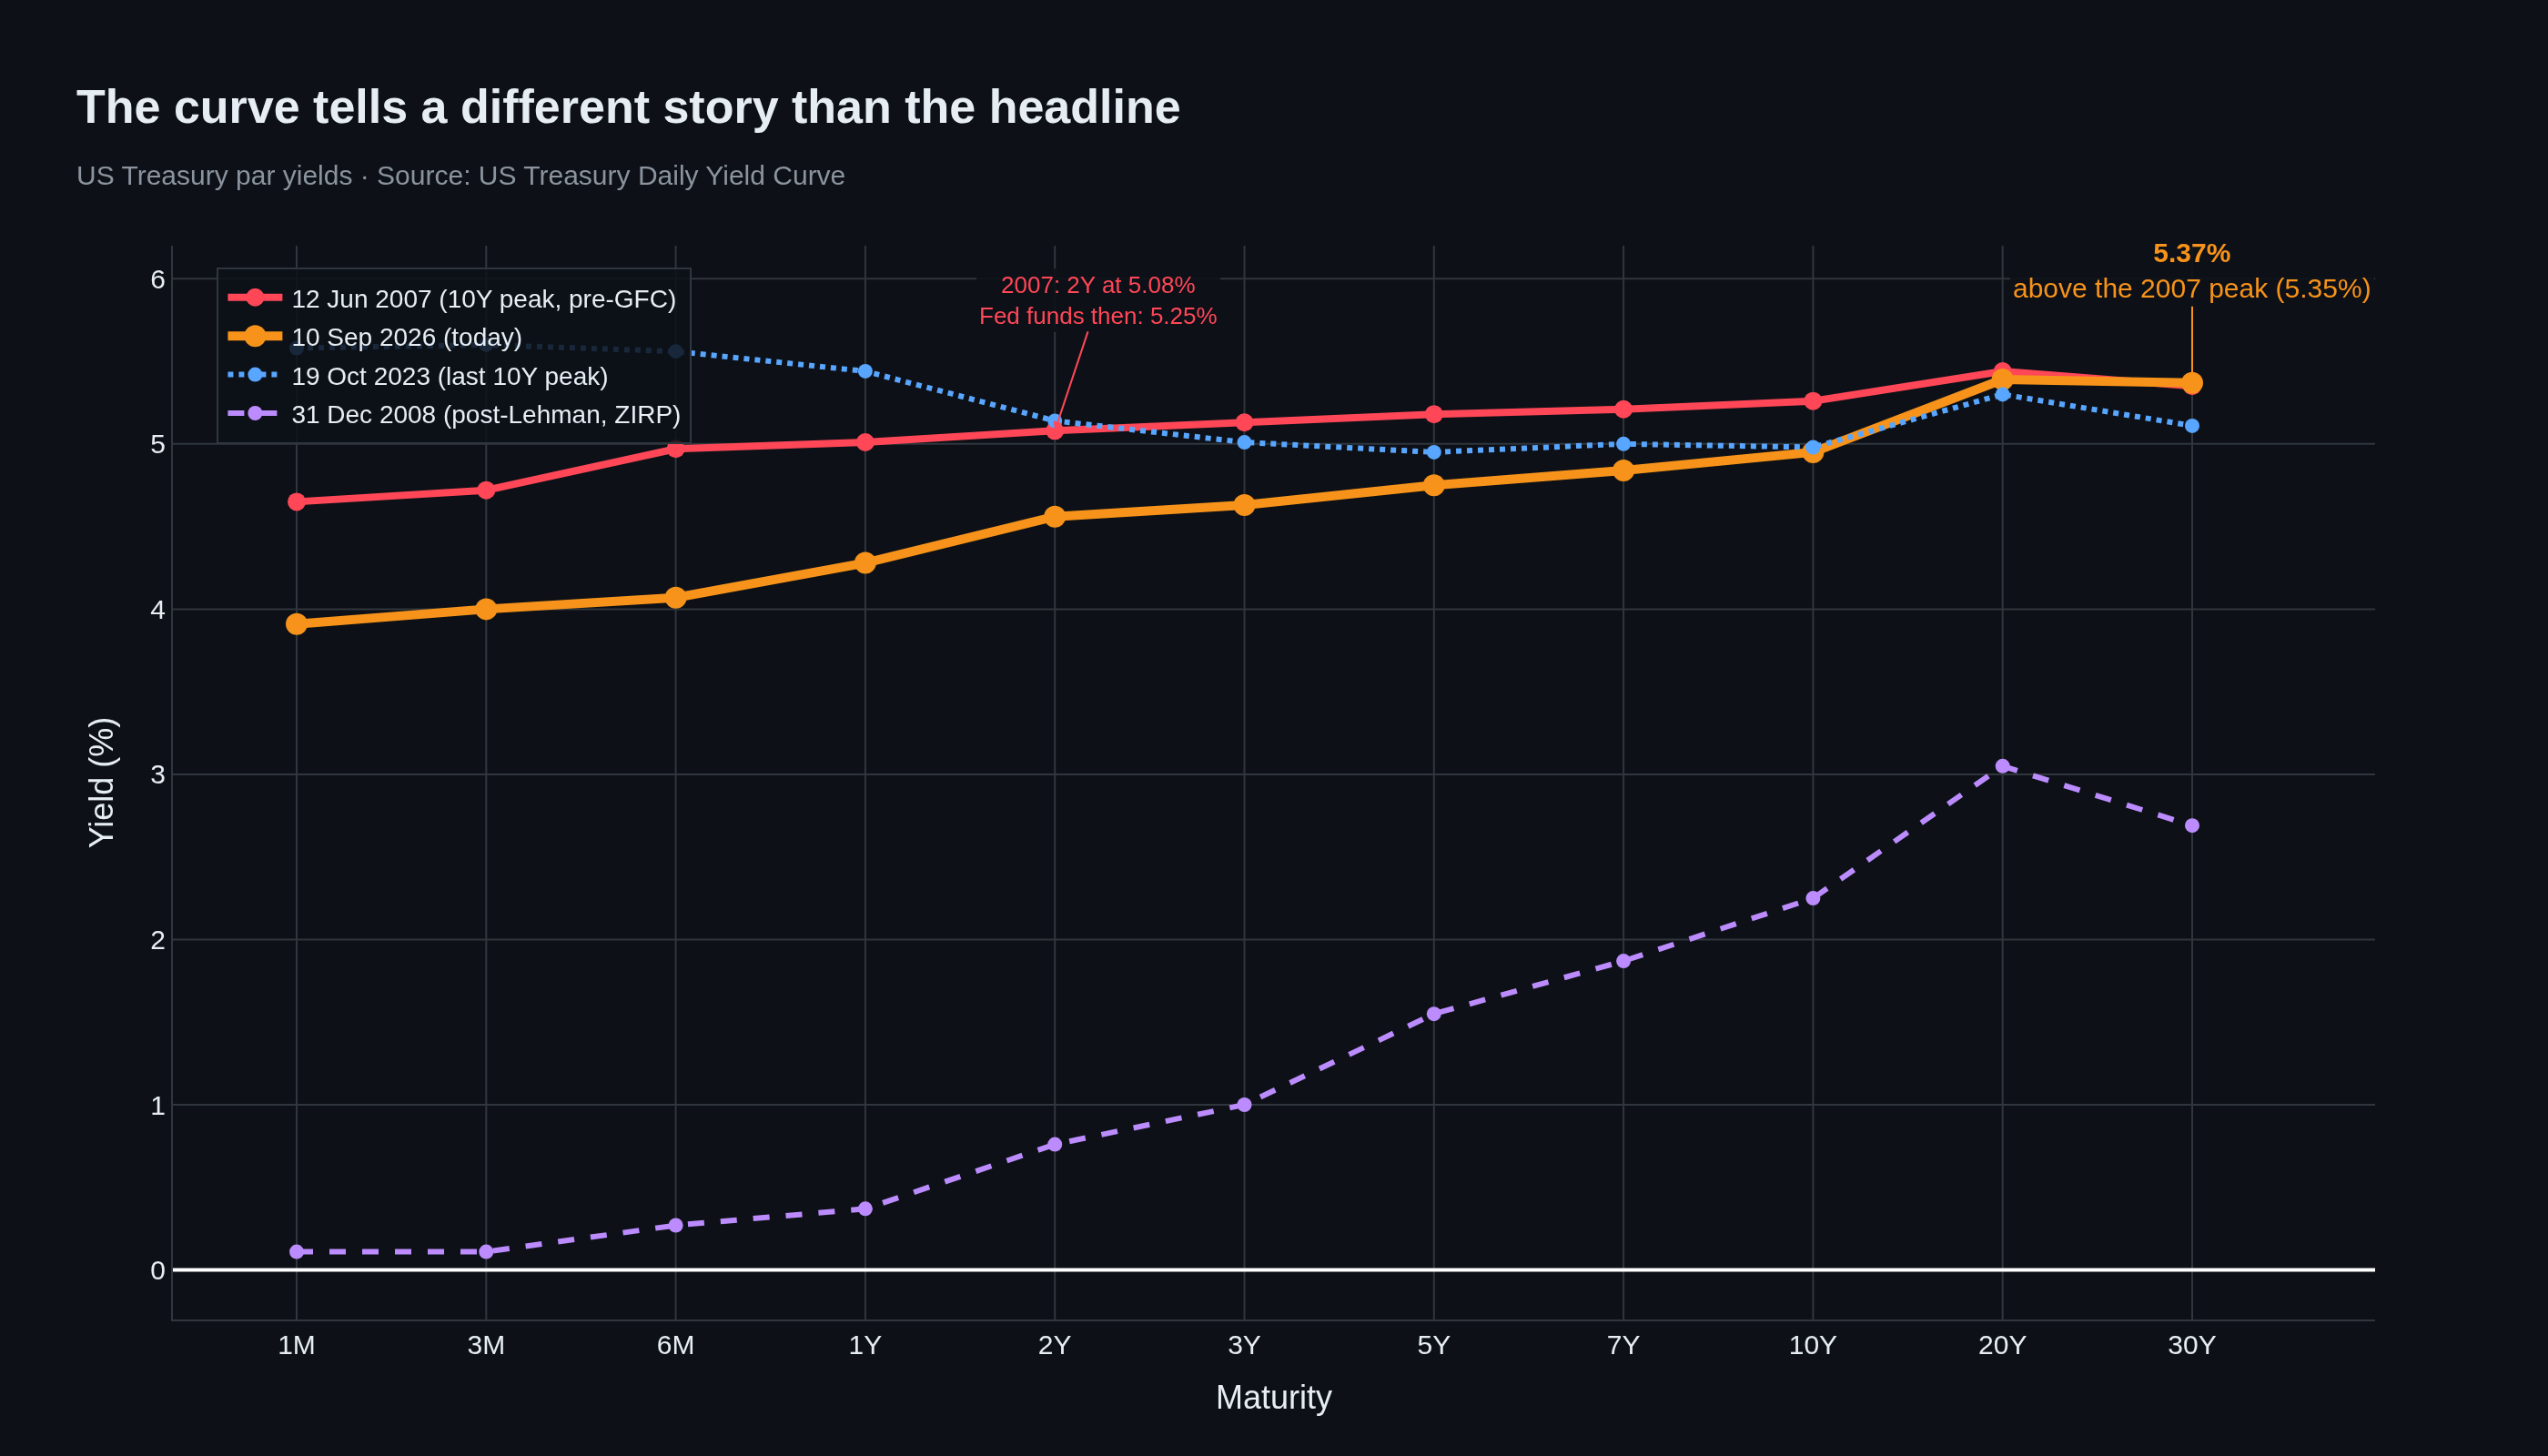
On 12 June 2007 the US curve looked like this: 2-year at 5.08%, 10-year at 5.26%, 30-year at 5.35%. A flat, nearly straight line from short to long.
That was no accident. The Federal Reserve had pushed the policy rate to 5.25% to fight inflation running at 2.7%. The curve was flat because the market believed the Fed would win — that short rates anchored the whole structure and the long end would eventually bend toward them.
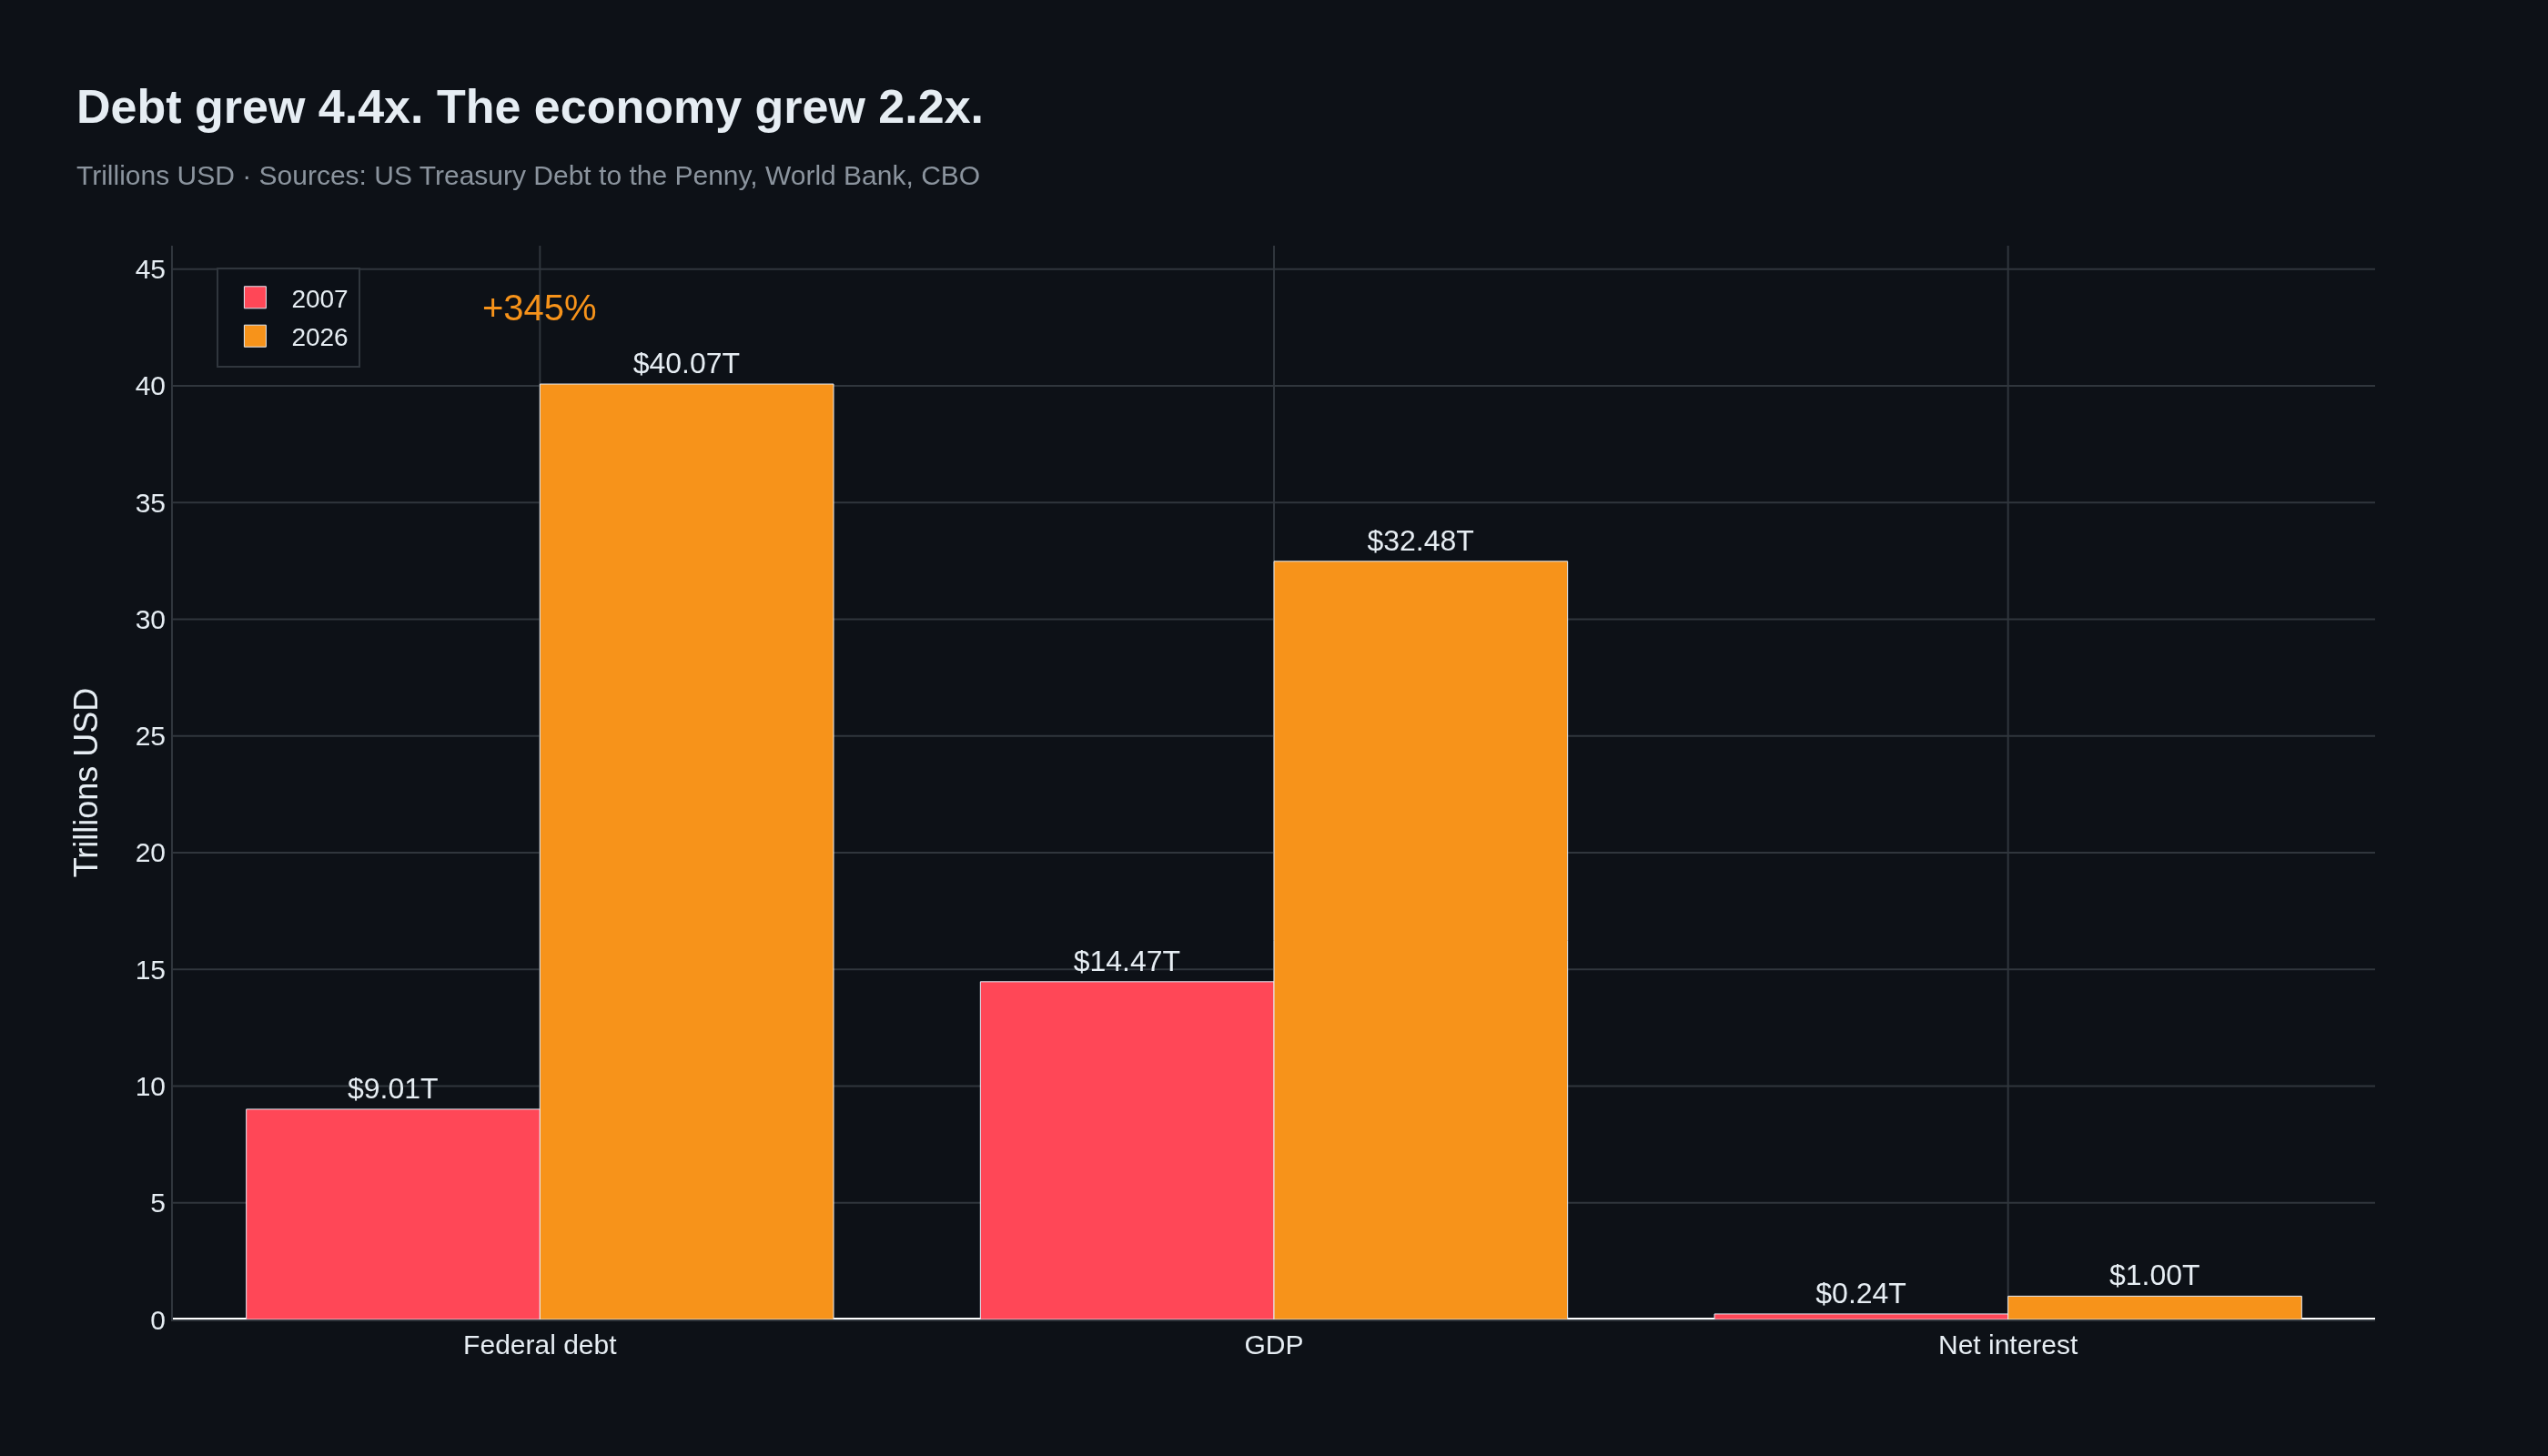
Federal debt stood at $9.0 trillion, 62% of GDP. Net interest cost $237 billion, 1.6% of GDP. The government spent more on defence than on interest.
And the real yield? The 10-year inflation-indexed bond paid 2.83%. That was an environment where saving was actually rewarded.
Today the 10-year pays 4.95%, the 30-year 5.37%, the 2-year 4.56%. The curve is not flat. It is bent upward: 2s10s at 39 basis points, 2s30s at 81.
The decisive difference sits at the short end. The policy rate is 3.50–3.75%, not 5.25%. The Fed in September 2026 is not fighting 2.7% inflation — it is arguing about whether to raise rates with inflation at 3.4% and oil above $100 a barrel. Fed funds futures price better than a 70% chance of a hike next week.
That is the inversion. In 2007 the Fed raised short rates to drag the long end up. In 2026 the long end is rising because the market no longer believes the Fed controls the short end.
The numbers underneath are brutally different. Debt is $40.07 trillion, 123% of GDP. Net interest has reached $1.0 trillion, 3.1% of GDP. It has now overtaken defence, Medicare, and every discretionary line except Social Security.
Four point four times the debt load of 2007. On two point two times the economy.
This is where it gets uncomfortable. The average interest rate on the entire US debt is about 2.5% today. That is what the government actually pays — not the 4.95% the market demands. The gap exists because most of the debt was issued during the zero-rate era and matures only gradually.
Every day that an old bond paying 1.5% is refinanced into one paying 4.5% raises that bill permanently. This is not a crisis you see in a week. It is one you cannot undo in a decade.
Run the arithmetic. At $40.07 trillion, every percentage point of average coupon costs a trillion dollars a year:
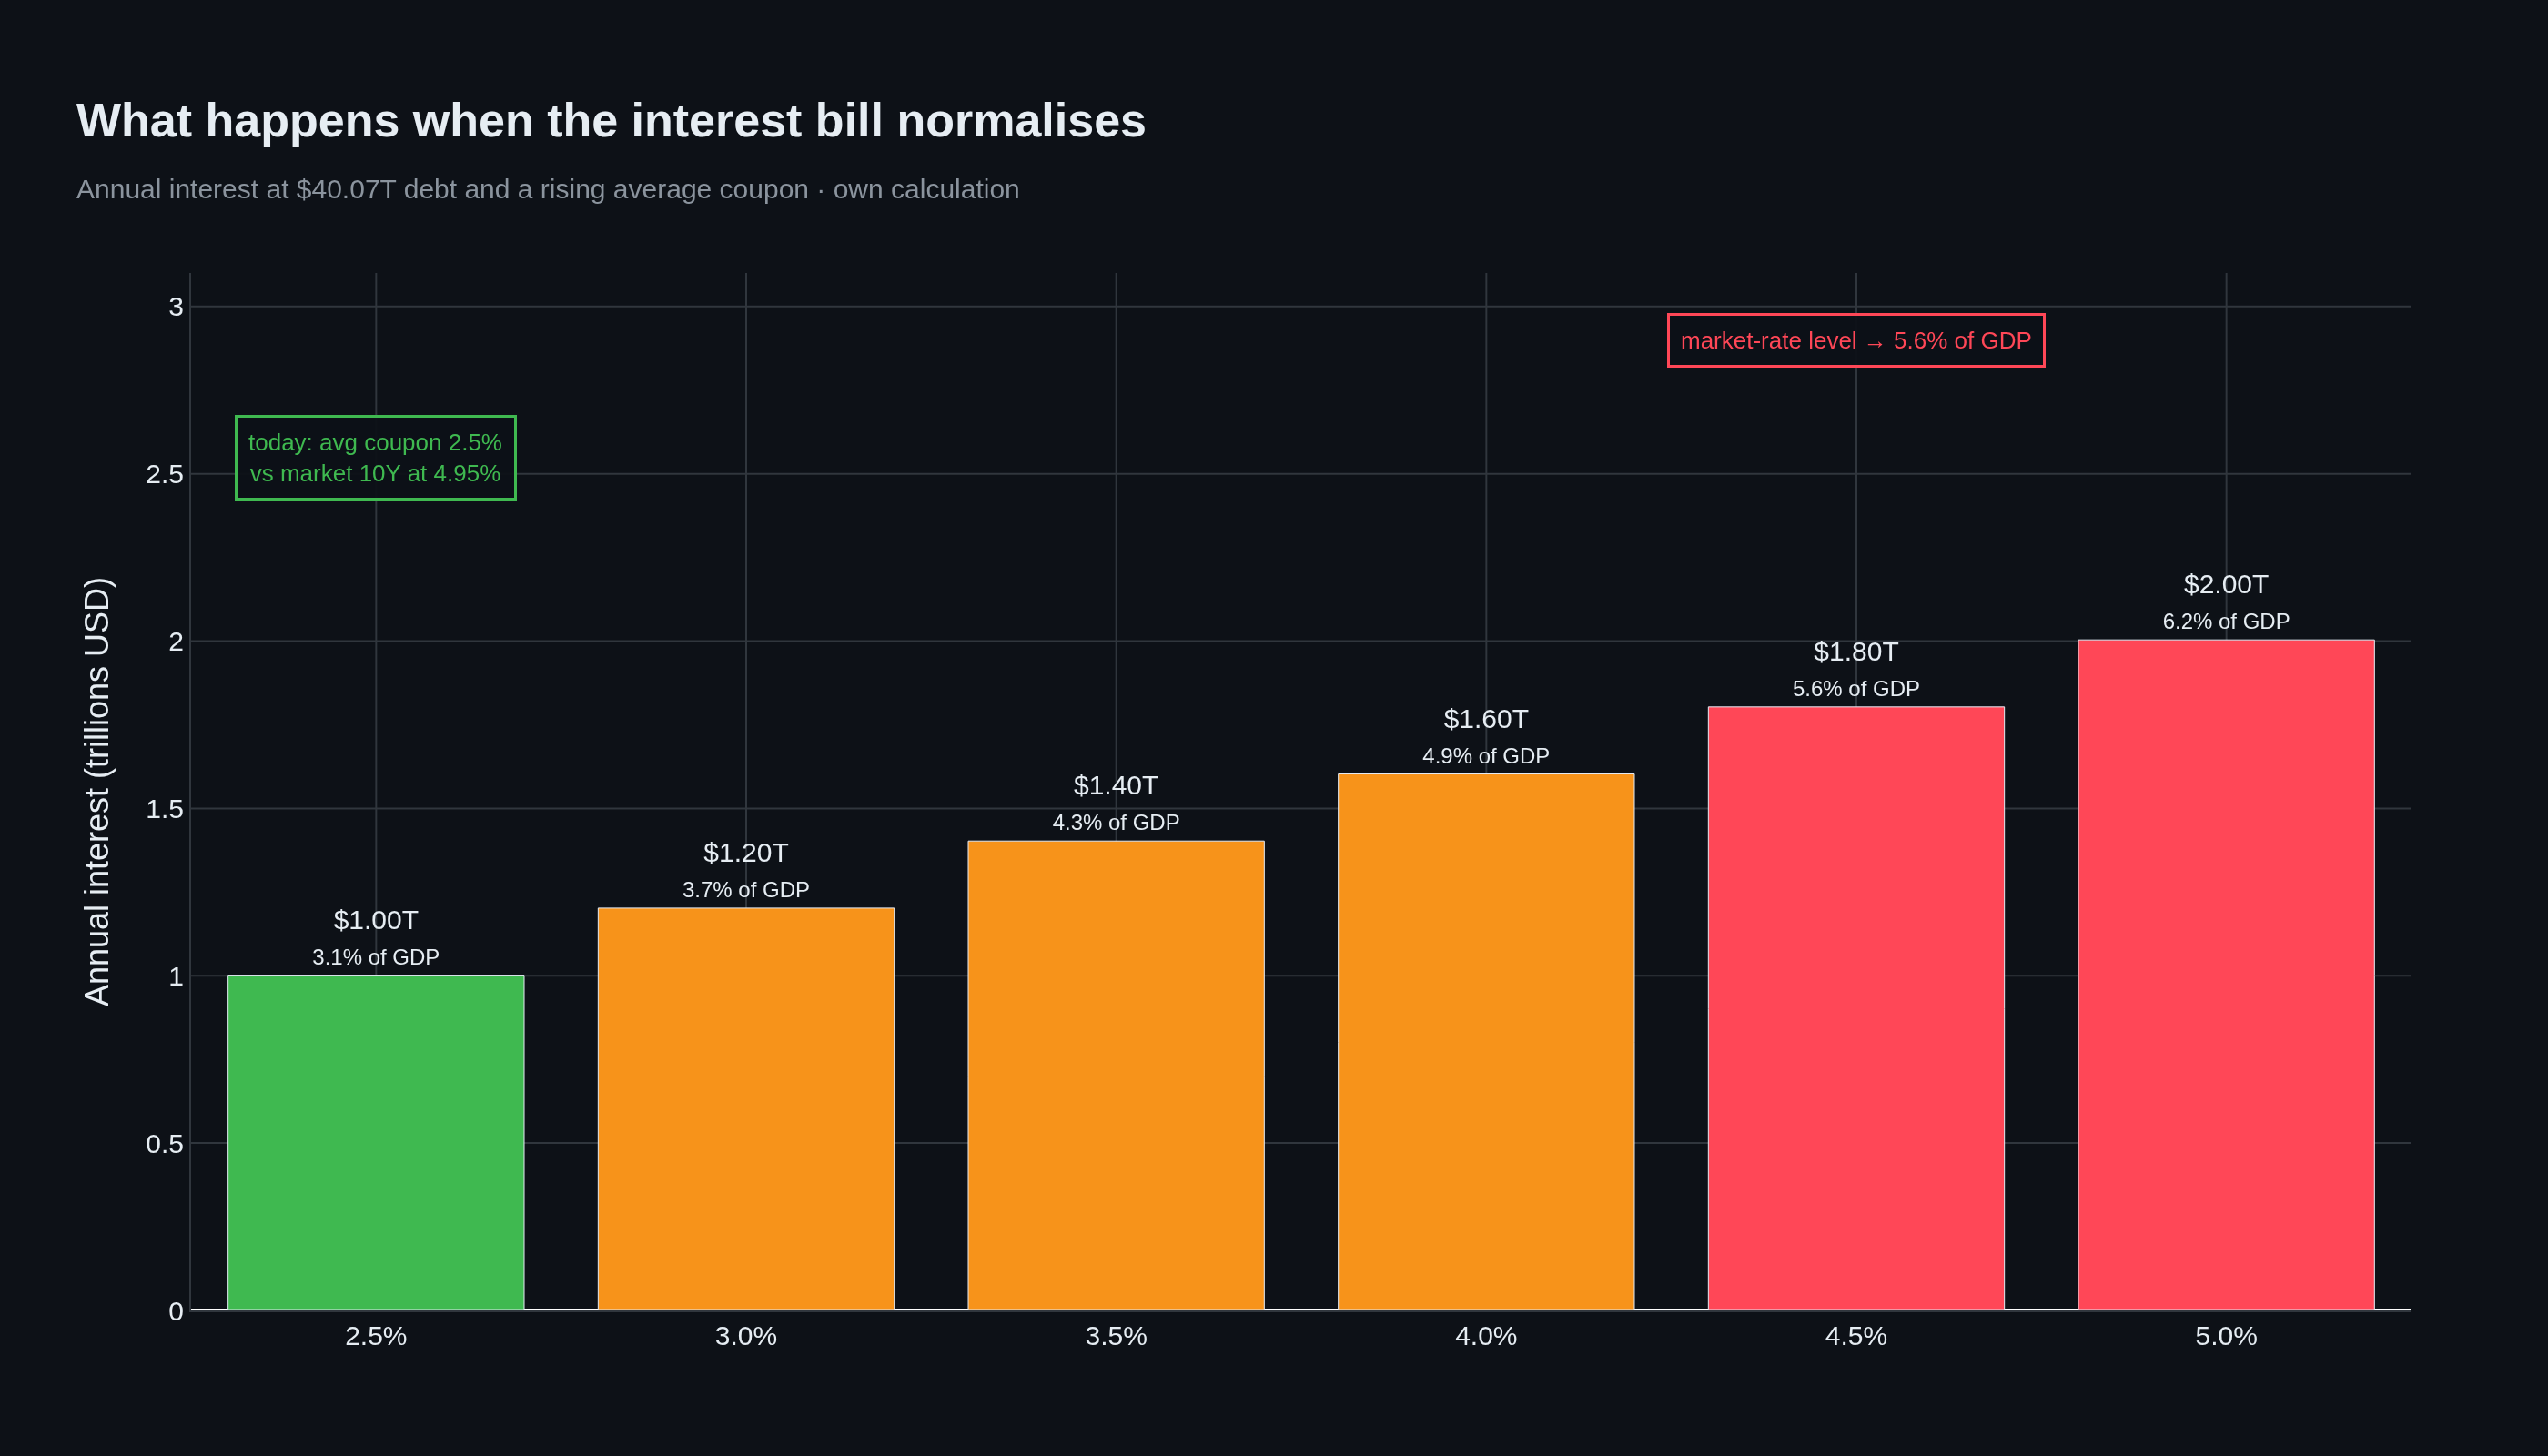
The difference between 2007 and 2026 is not the level of rates. It is that in 2007, with policy at 5.25%, a debt ratio of 62% was carryable. In 2026, with policy at 3.75%, a debt ratio of 123% is already borderline — and the market knows it.
The real shock is not nominal. It is real. The 10-year inflation-indexed Treasury pays 2.55% today. The 30-year pays 3.05%.
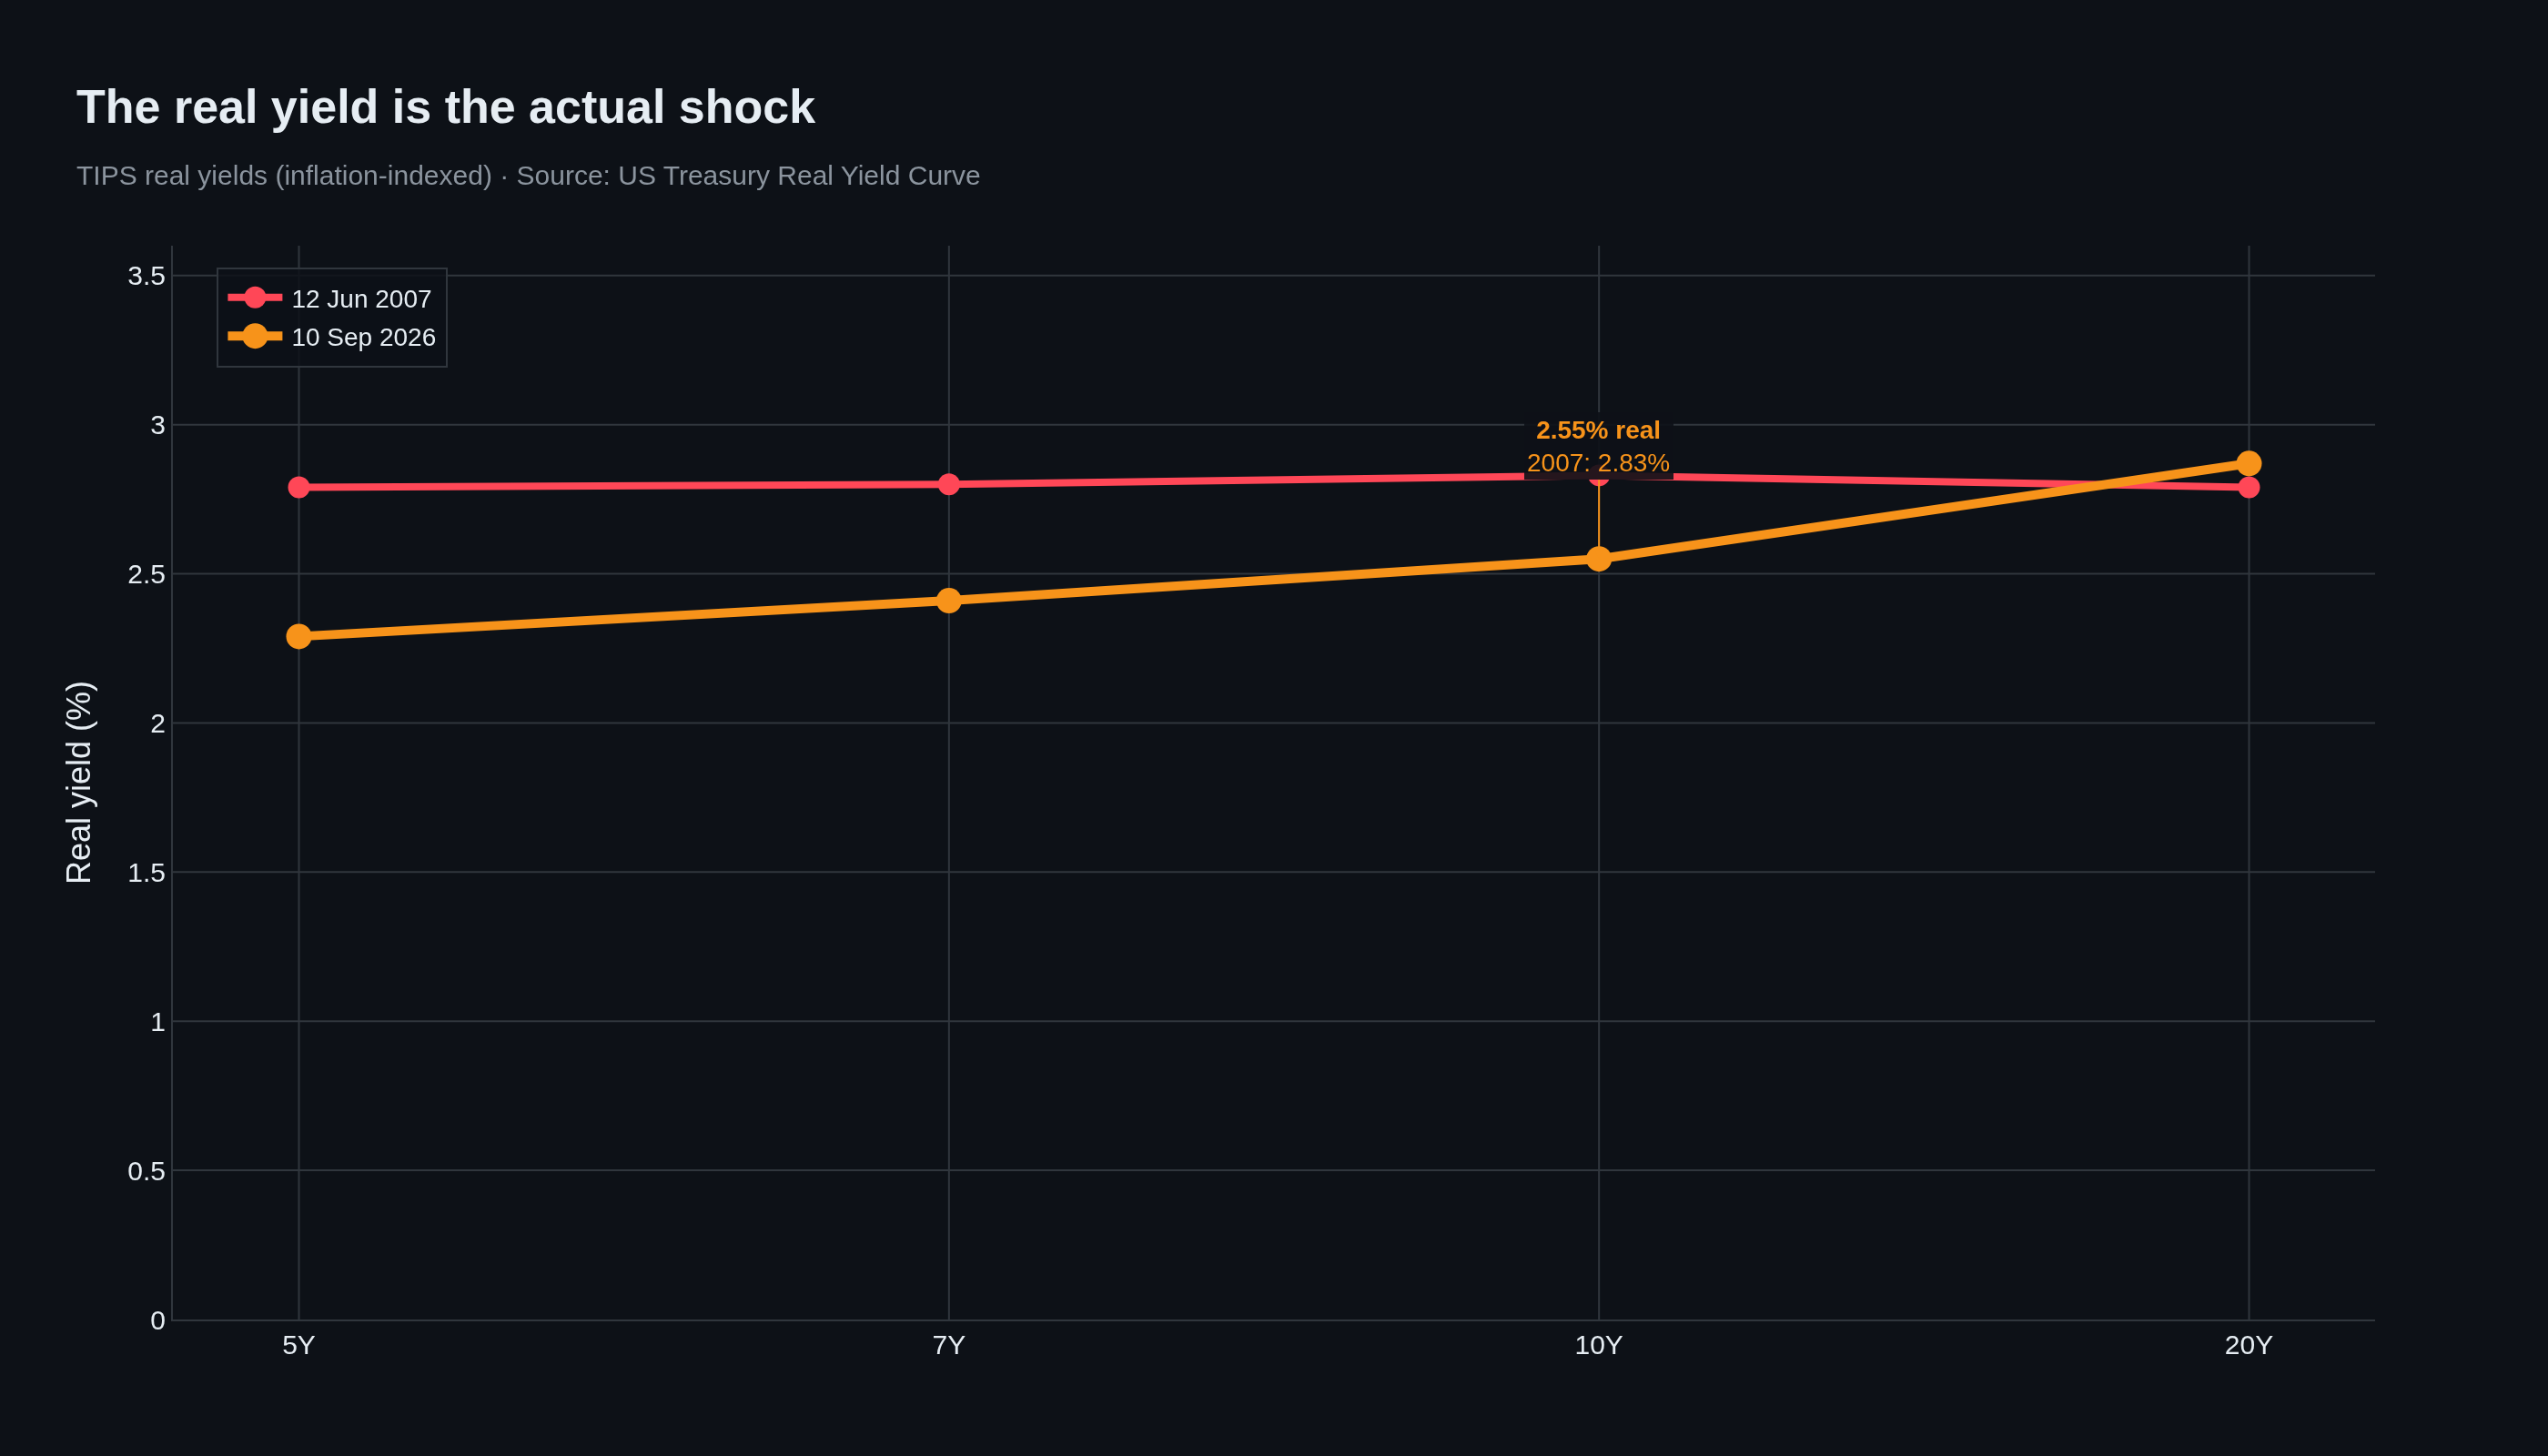
Why that matters is arithmetic no politician says out loud. A country's debt ratio stabilises only if the growth rate of the economy (g) is at least as high as the real interest rate (r). When r sits above g, the debt ratio grows mechanically — with no new deficits at all, purely through compounding.
The US has a real trend growth rate of roughly 2%. The real rate is 2.55% and rising. So r is above g, and the gap is widening. That is the point at which a debt ratio stops escaping through growth.
This is exactly where financial repression enters — not as a conspiracy, but as the only remaining option nobody wants to name.
Financial repression is a term coined by economists Reinhart and Sbrancia in 2015. It describes any policy that holds the real interest rate the government pays artificially below the market rate, in order to erode debt — paid for by savers.
The toolkit is old and well documented. After 1945 the US and Britain did precisely this to work down war debts above 100% of GDP. The methods:
First: a rate below inflation. With inflation at 3.4% and the 10-year at 4.95%, the real return is 1.55% before tax. After tax on interest income at a 37% top rate, a saver facing 3.4% inflation keeps roughly 0.7% real. Anyone parked in shorter maturities loses outright.
Second: regulating the demand side. Banks are pushed into holding government bonds through capital requirements, liquidity rules and central bank facilities — regardless of whether those bonds offer a fair return. Basel III treats sovereign debt as risk-free, which manufactures structural demand independent of price.
Third: crowding out private alternatives. Tax advantages for certain vehicles, restrictions on pension funds, capital controls — all instruments that stop the saver from escaping the erosion.
Fourth: the central bank as buyer. Quantitative easing is, at its core, yield curve control. When the Fed buys bonds it pushes the yield below what the market would otherwise demand.
The irony of the current moment: repression is already running, and it has stopped working properly. The market is demanding a higher term premium — compensation for the risk that the policy will not hold. That is precisely what is driving the long end.
Here is the resolution of the parallel. The 2007 curve was a symptom, not a trigger. What actually happened in 2007 was the collapse of the private credit market: subprime mortgages, CDOs, a shadow banking system with leverage nobody could see. Rates were the backdrop.
That problem does not exist in the same form in 2026. Banks are better capitalised, private credit leverage is more regulated, household debt service ratios are lower. The credit bomb that detonated in 2008 is not the same bomb.
The problem in 2026 is different, and harder to solve. It is a problem of the state itself. Not a market participant that is overleveraged, but the issuer of the world's reserve currency, whose interest bill rises structurally while its political class cannot pass spending cuts.
In 2007 the Fed could cut rates, flood the market with liquidity and rescue the banks. The state had the balance sheet for it. In 2026 the state no longer does. The interest bill is already high enough that every rate move by the Fed works against its own budget.
That is the real news behind 5.37%: not that a 2008-style crisis is coming, but that the mechanism which made the 2008 rescue possible has itself become the problem.
The US could grow out of this. If AI delivers the productivity boom the new Fed chair is betting on, real growth could run above the real rate, the debt ratio stabilises, and none of the above matters. That is not a fringe view. It is the base case of several serious economists, and the 1990s are the precedent: debt ratios fell then on growth, not austerity.
It may also be wrong for a boring reason. Productivity booms take a decade to show up in the data, and the interest bill compounds annually. The arithmetic does not wait for the technology.
Bitcoin does not pay a coupon. In a world with a 2.55% real yield on Treasuries, that is a disadvantage — and it is why bitcoin has been so weak this cycle.
The comparison with gold is unforgiving. At the December 2024 peak, one bitcoin bought 40 ounces of gold. Today it buys 17.7, a decline of 56%.
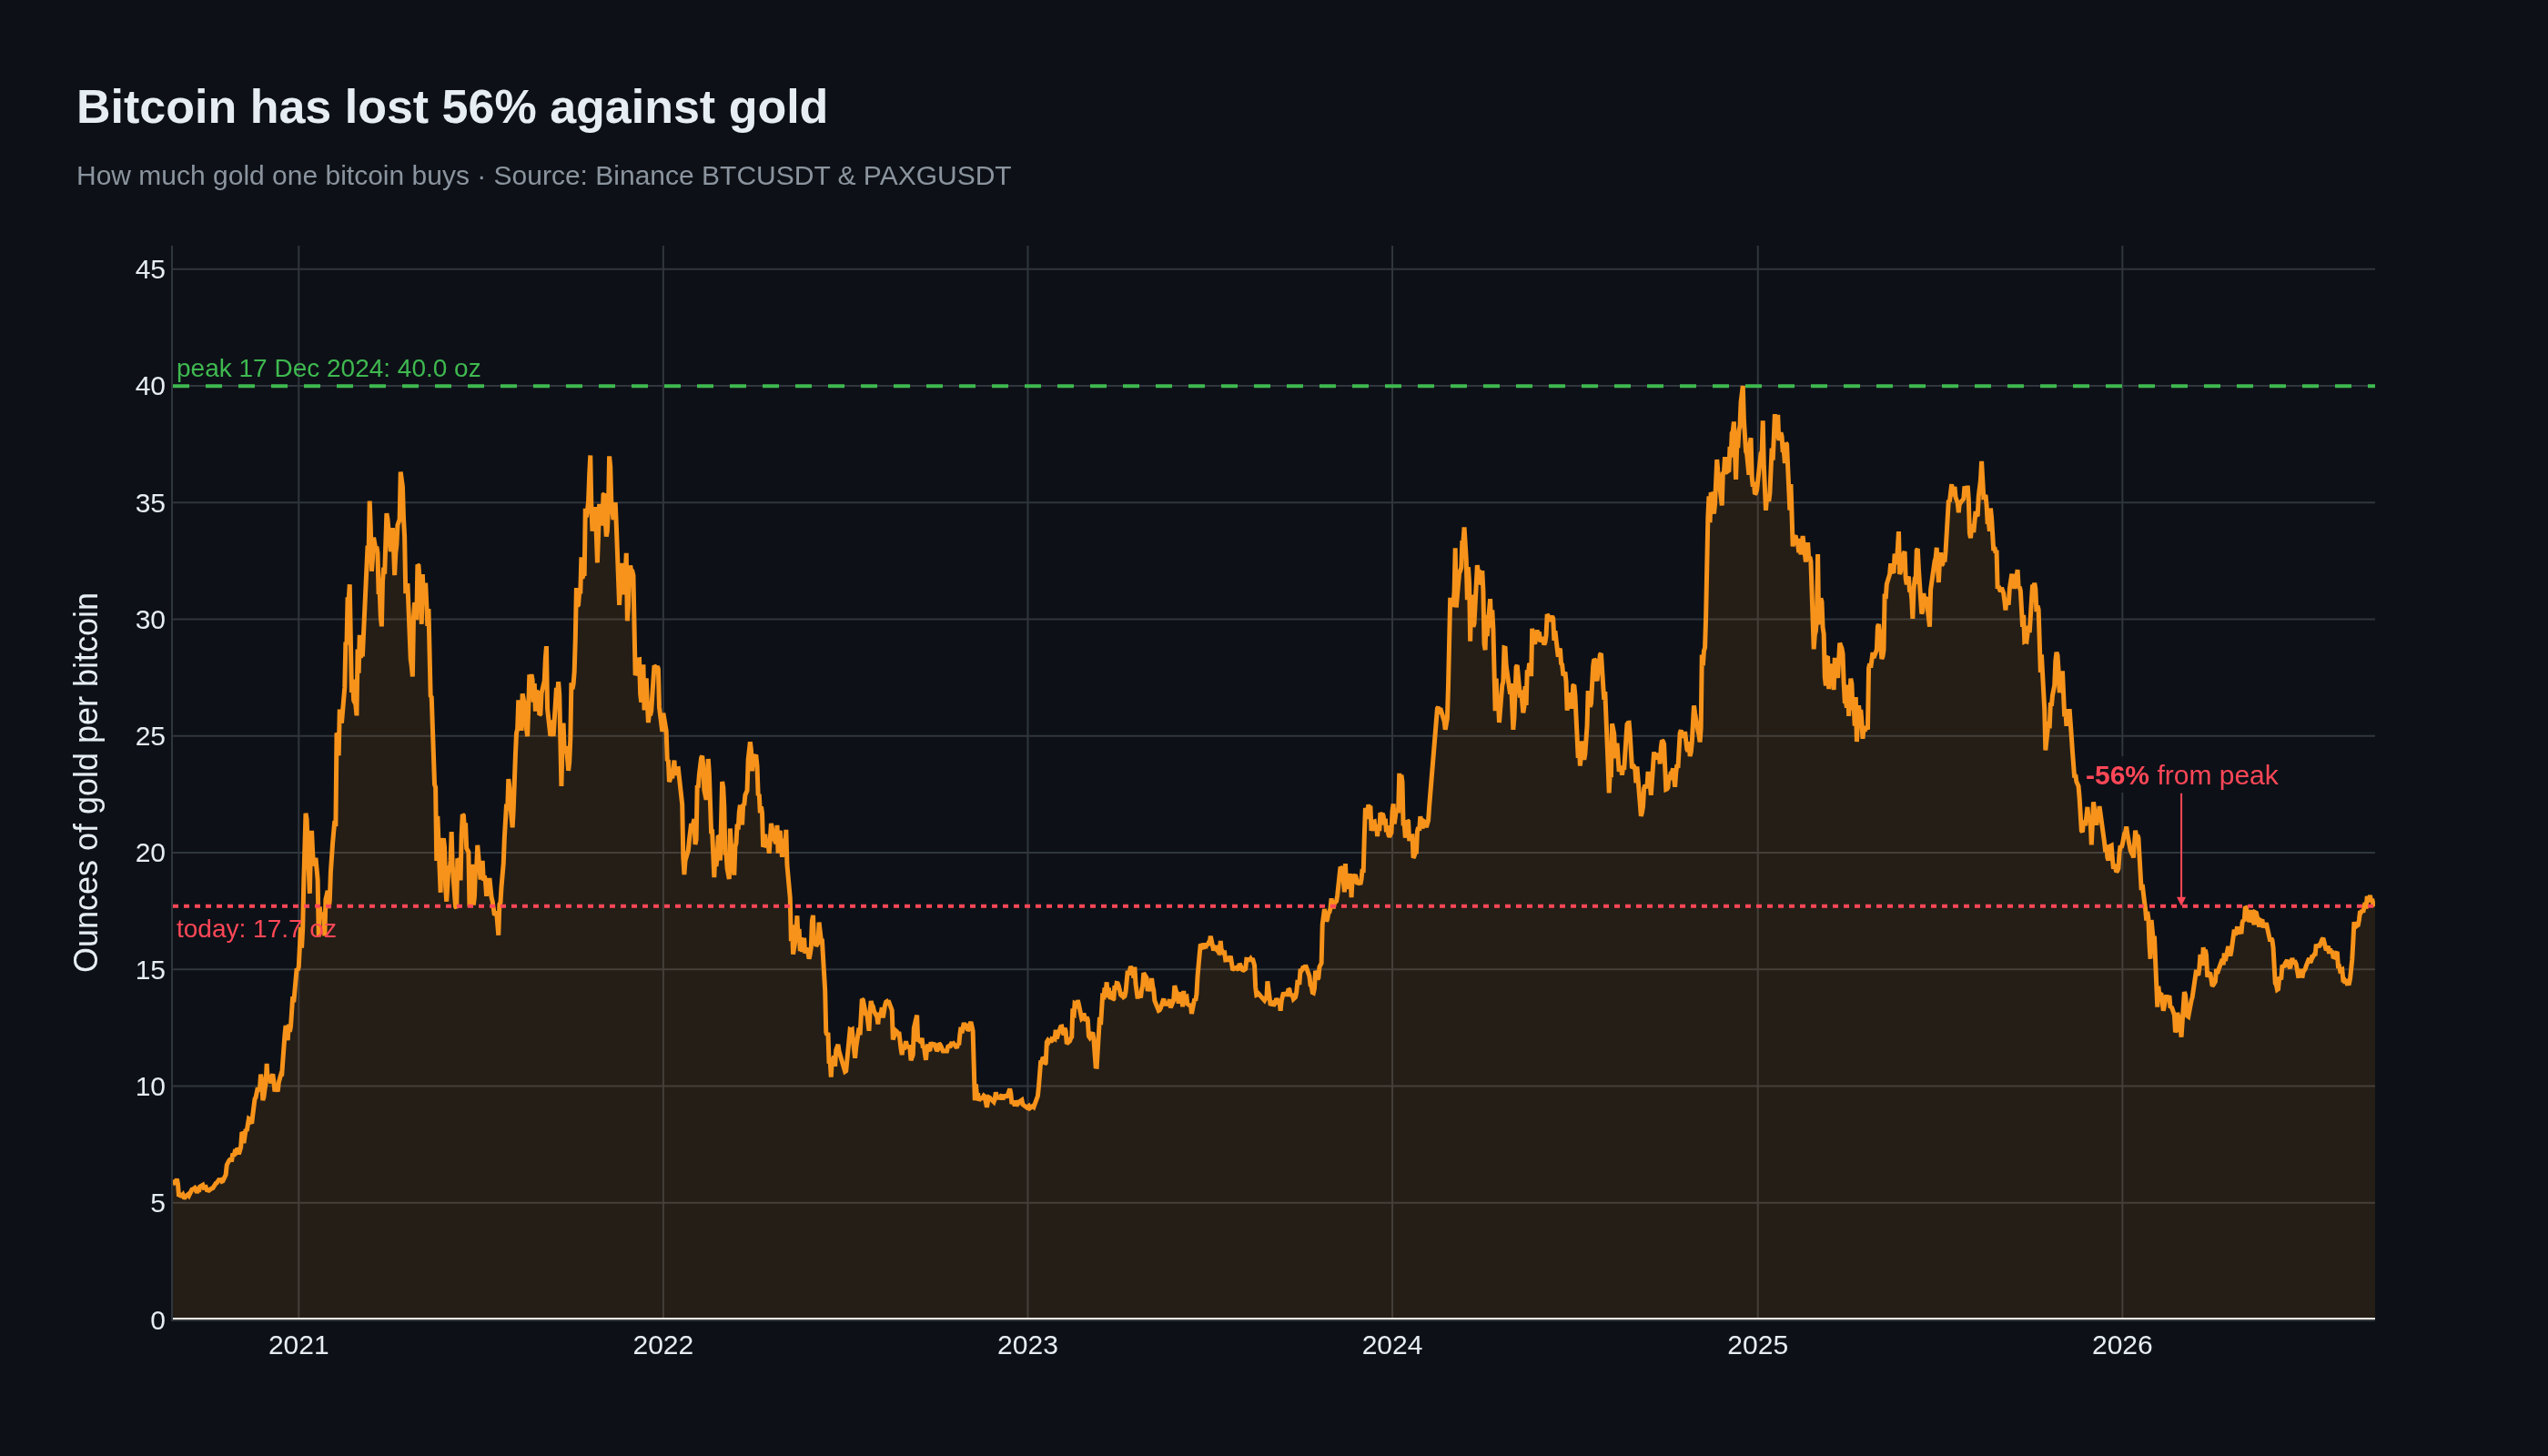
That is the hardest benchmark bitcoin has. Gold also pays no coupon — but gold does not compete with a 4.95% risk-free yield on the world's reserve currency.
Bitcoin sits roughly 39% below its all-time high of $126,080 (October 2025). Historically, that is nothing. The 2018 bear took it down 83%. The 2022 bear, 76%.
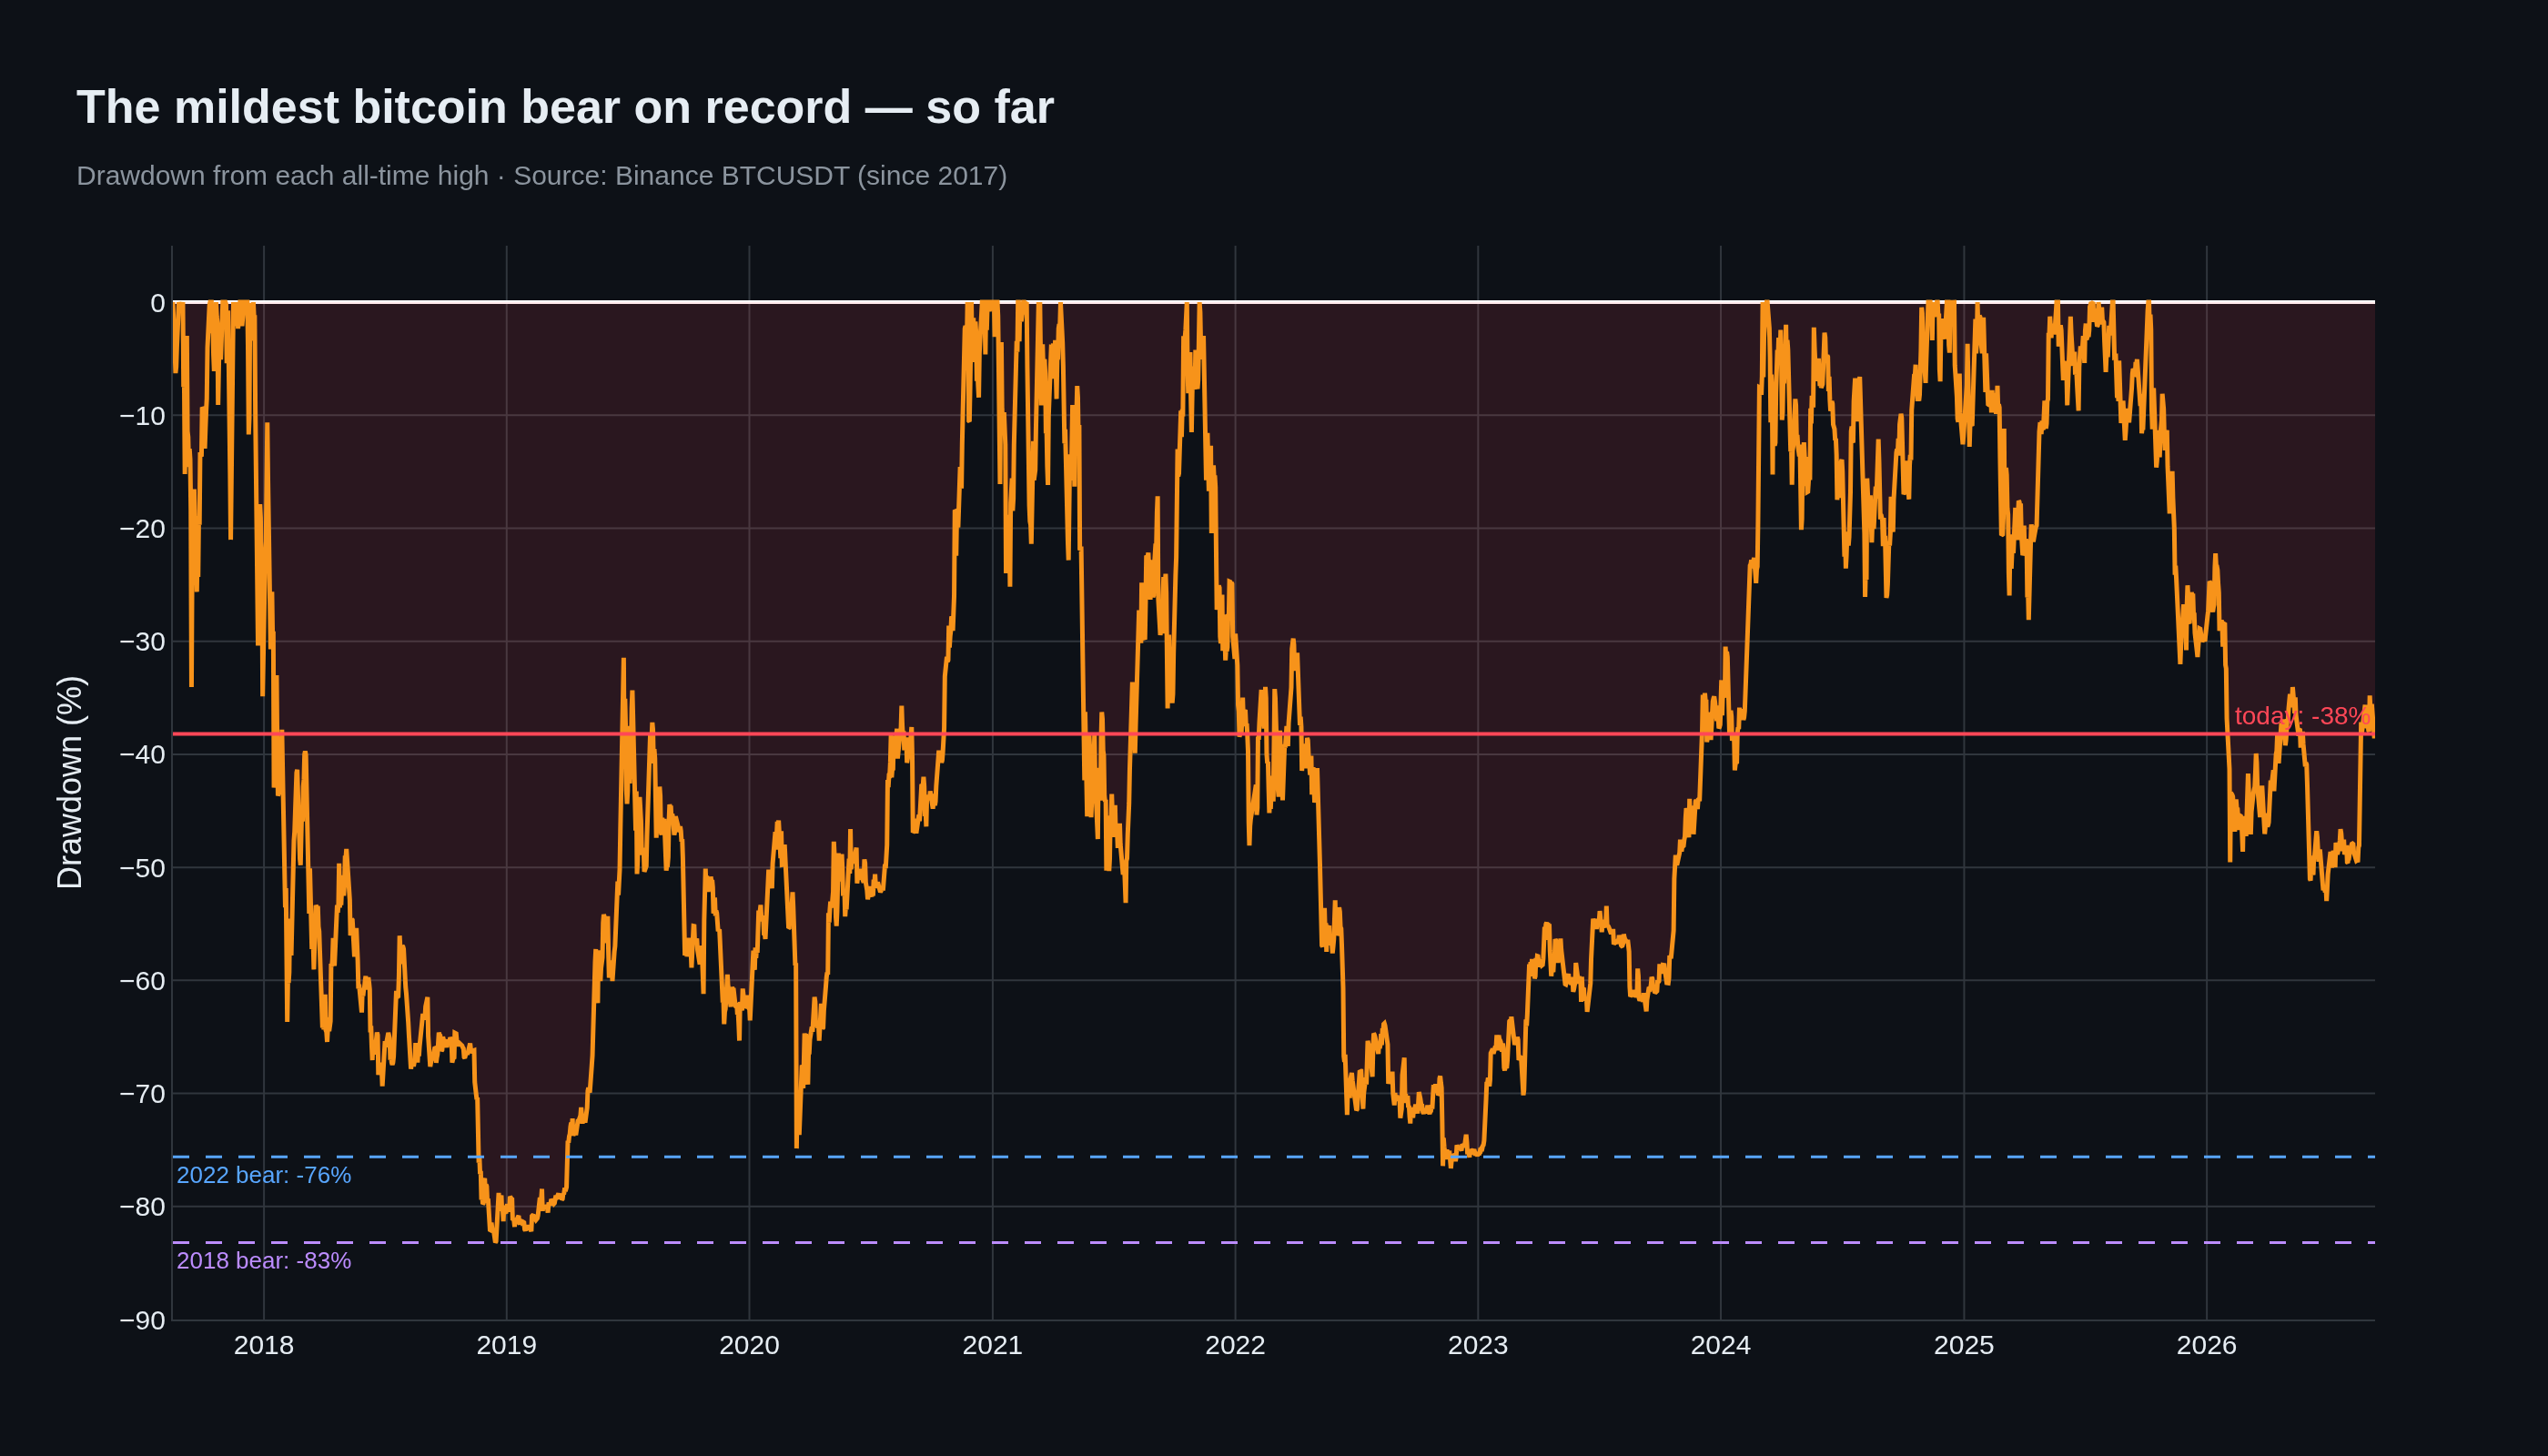
Anyone concluding the bottom is in should notice something. Every one of those bears ended when rates fell again. 2018 ended when the Fed cut. 2022 ended when the Fed cut. The trigger was never bitcoin itself. It was the return of negative real rates.
If bitcoin is a bet against financial repression, the right question is not "when does the price rise" but "when does the policy give way".
The mechanism is this. When the interest bill reaches 5.6% of GDP and the political class must choose between spending cuts and default, it will take the third option: more repression. That means negative real rates, central bank buying, and a currency that loses against hard assets.
In that scenario the 4.95% yield stops working as competition. A bond paying 4.95% nominal and 1.55% real is not a safe asset. It is a guaranteed slow loss. Once that is widely understood, capital moves.
What that means in numbers, with 20.08 million bitcoin in circulation:
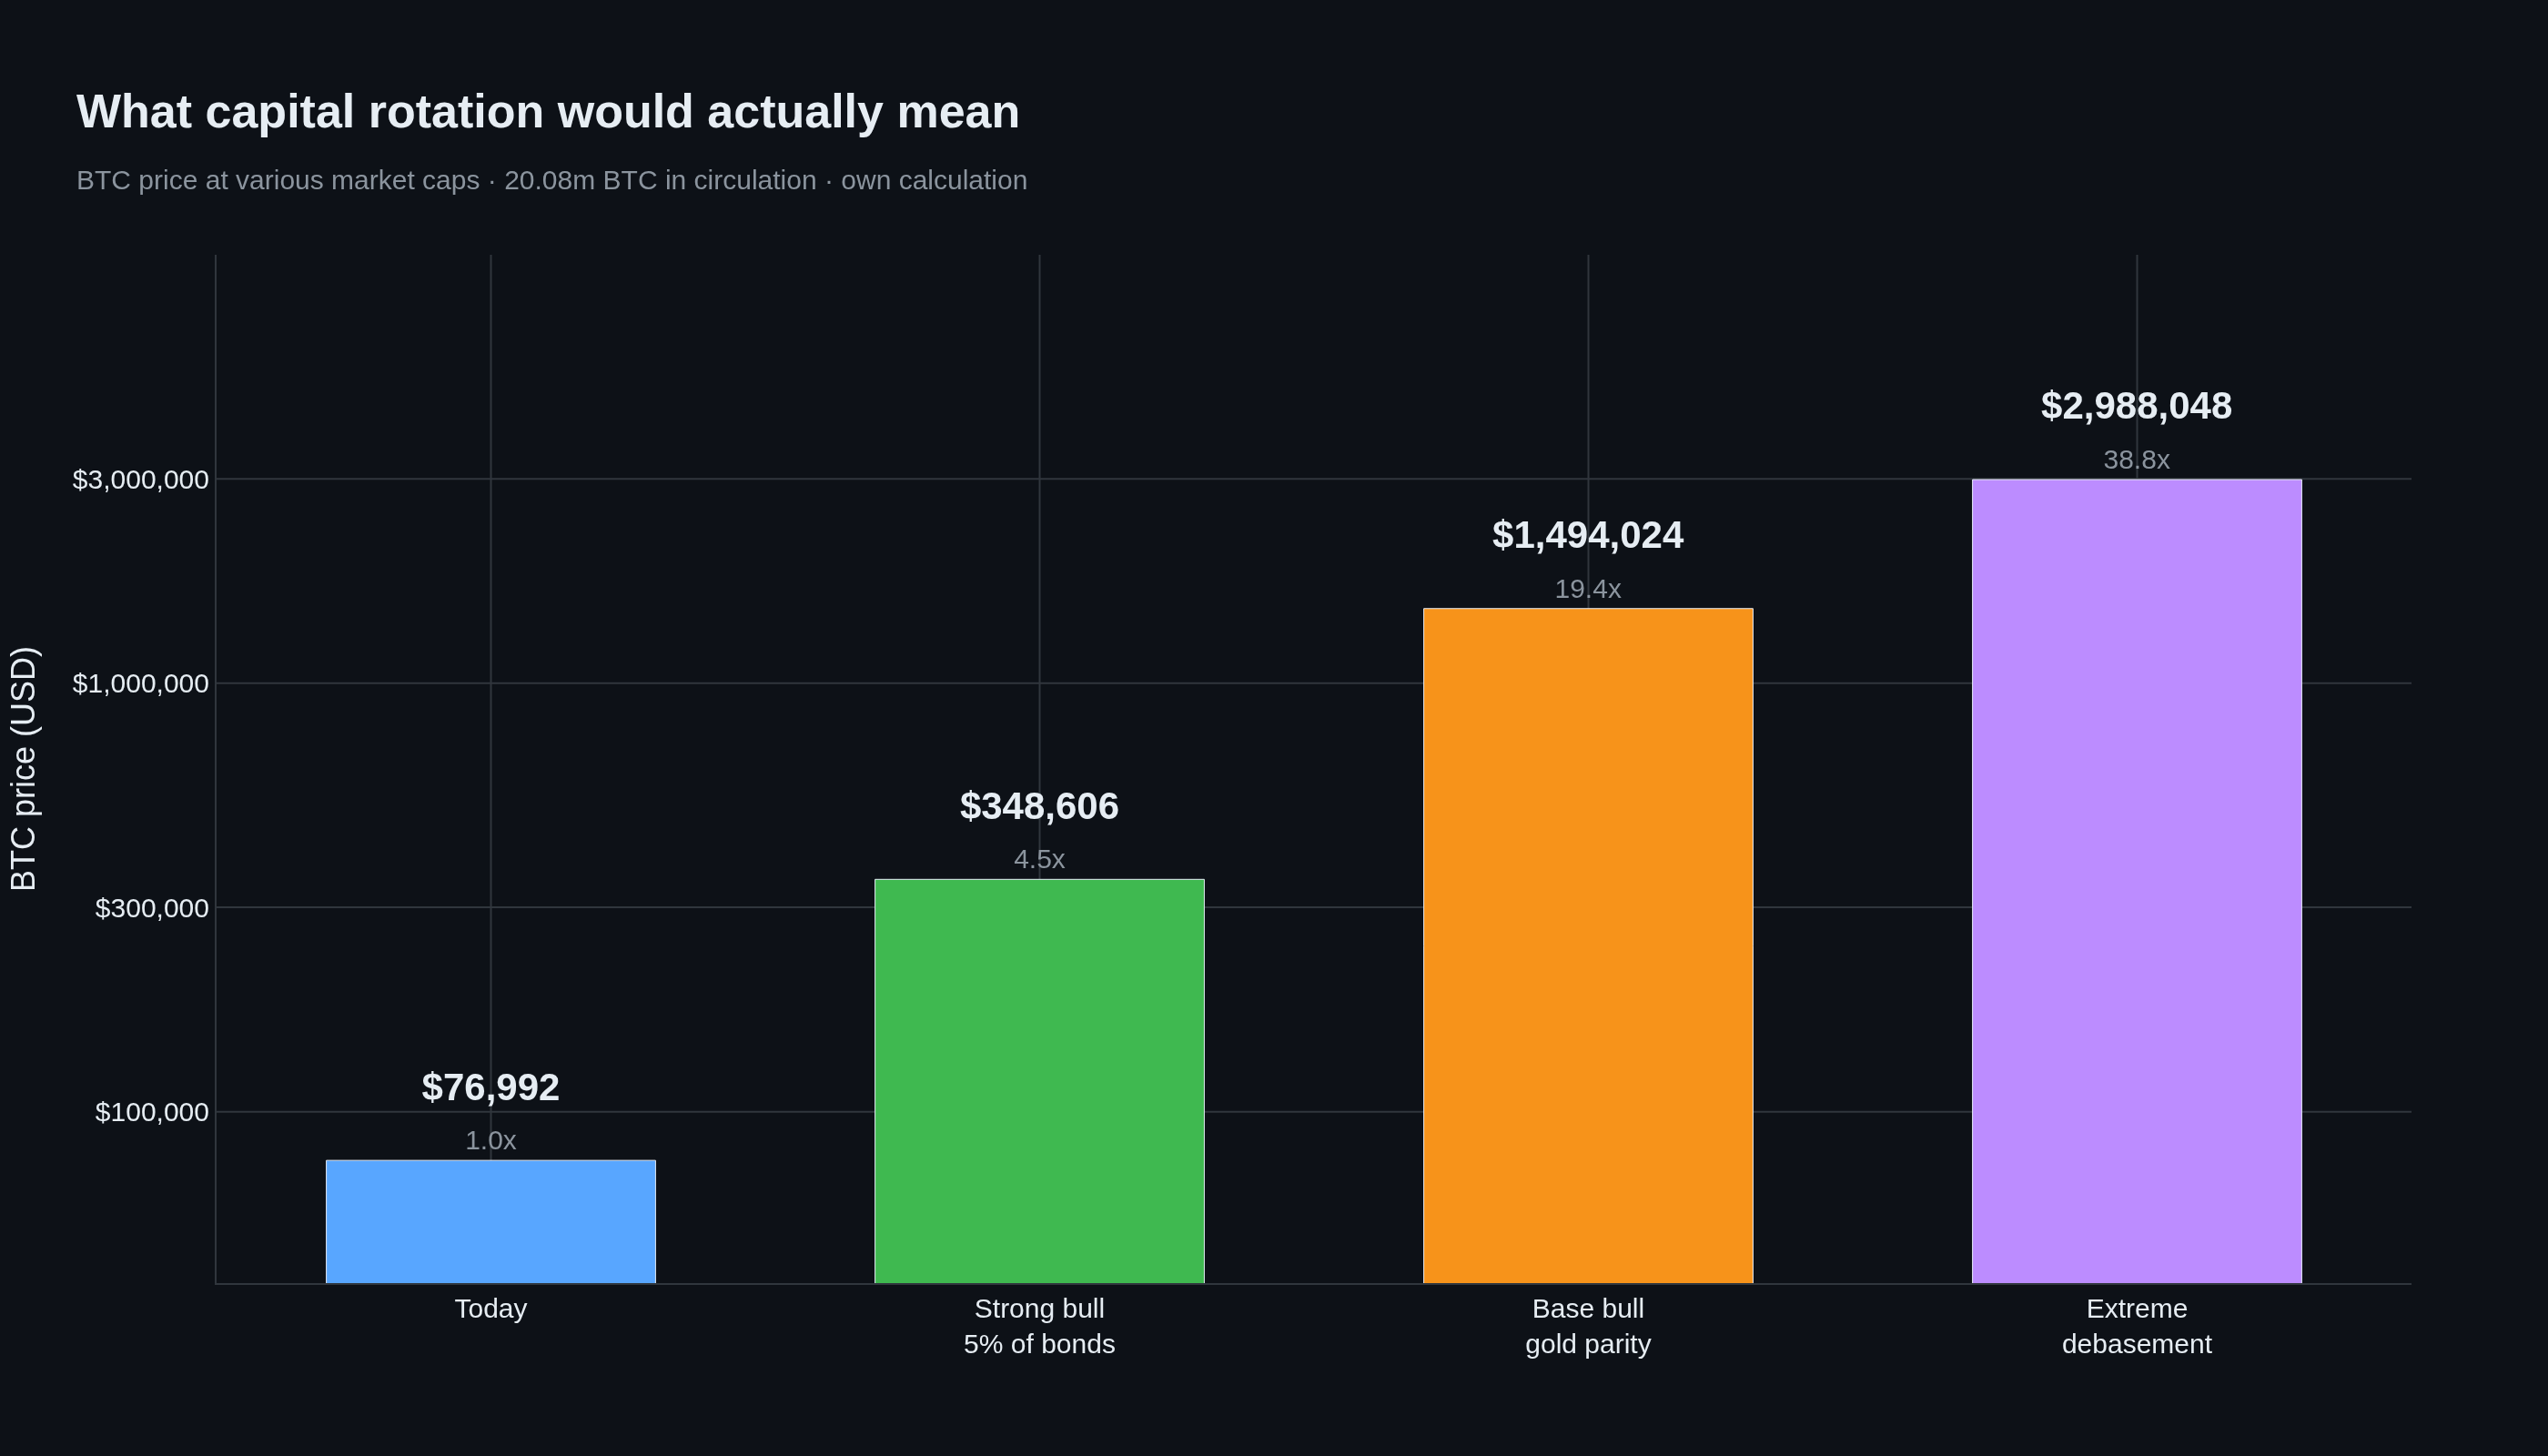
These are not forecasts. They are conversions. If X capital moves into a system with a fixed supply, the price is Y. The point is not which scenario arrives. It is that the magnitude of the bull case does not depend on bitcoin. It depends on the volume of capital that has to leave bonds.
What is not in this piece: when.
The 2007 curve did not cause the crisis. It accompanied it. Today's 5.37% is not a countdown. It is entirely possible rates sit at this level for another year or five, that the US keeps selling bonds, and that repression works quietly rather than dramatically.
Bitcoin could fall further. The 2022 bear reached a 76% drawdown. From here that is about $30,000. Nothing in the fundamentals rules it out.
But the structure is clear. A state with a 123% debt ratio, a $1 trillion interest bill and a real rate above its growth rate has three options: cut, default, or debase. The first is politically impossible, the second is catastrophic, and the third is a slow process called inflation.
The 2007 bond was a signal that a private credit market had run too hot. The 2026 bond is a signal that the issuer itself is the problem. That is not a repeat. It is something new.