The US ten-year Treasury closed at 5.29 percent on 30 September, its highest since May 2002, and 99 of the 110 basis points of this year's rise came from the real yield rather than inflation. Japan cut 135 billion dollars of Treasuries while its own ten-year broke 3 percent for the first time since 1996. Two government disability datasets broke trend in the same month. What the long end is repricing is capital itself, and the fixed-supply asset traded with the Nasdaq instead.
1 Oct 20262,773 words · 12 minAlso on Nostr as a long-form note
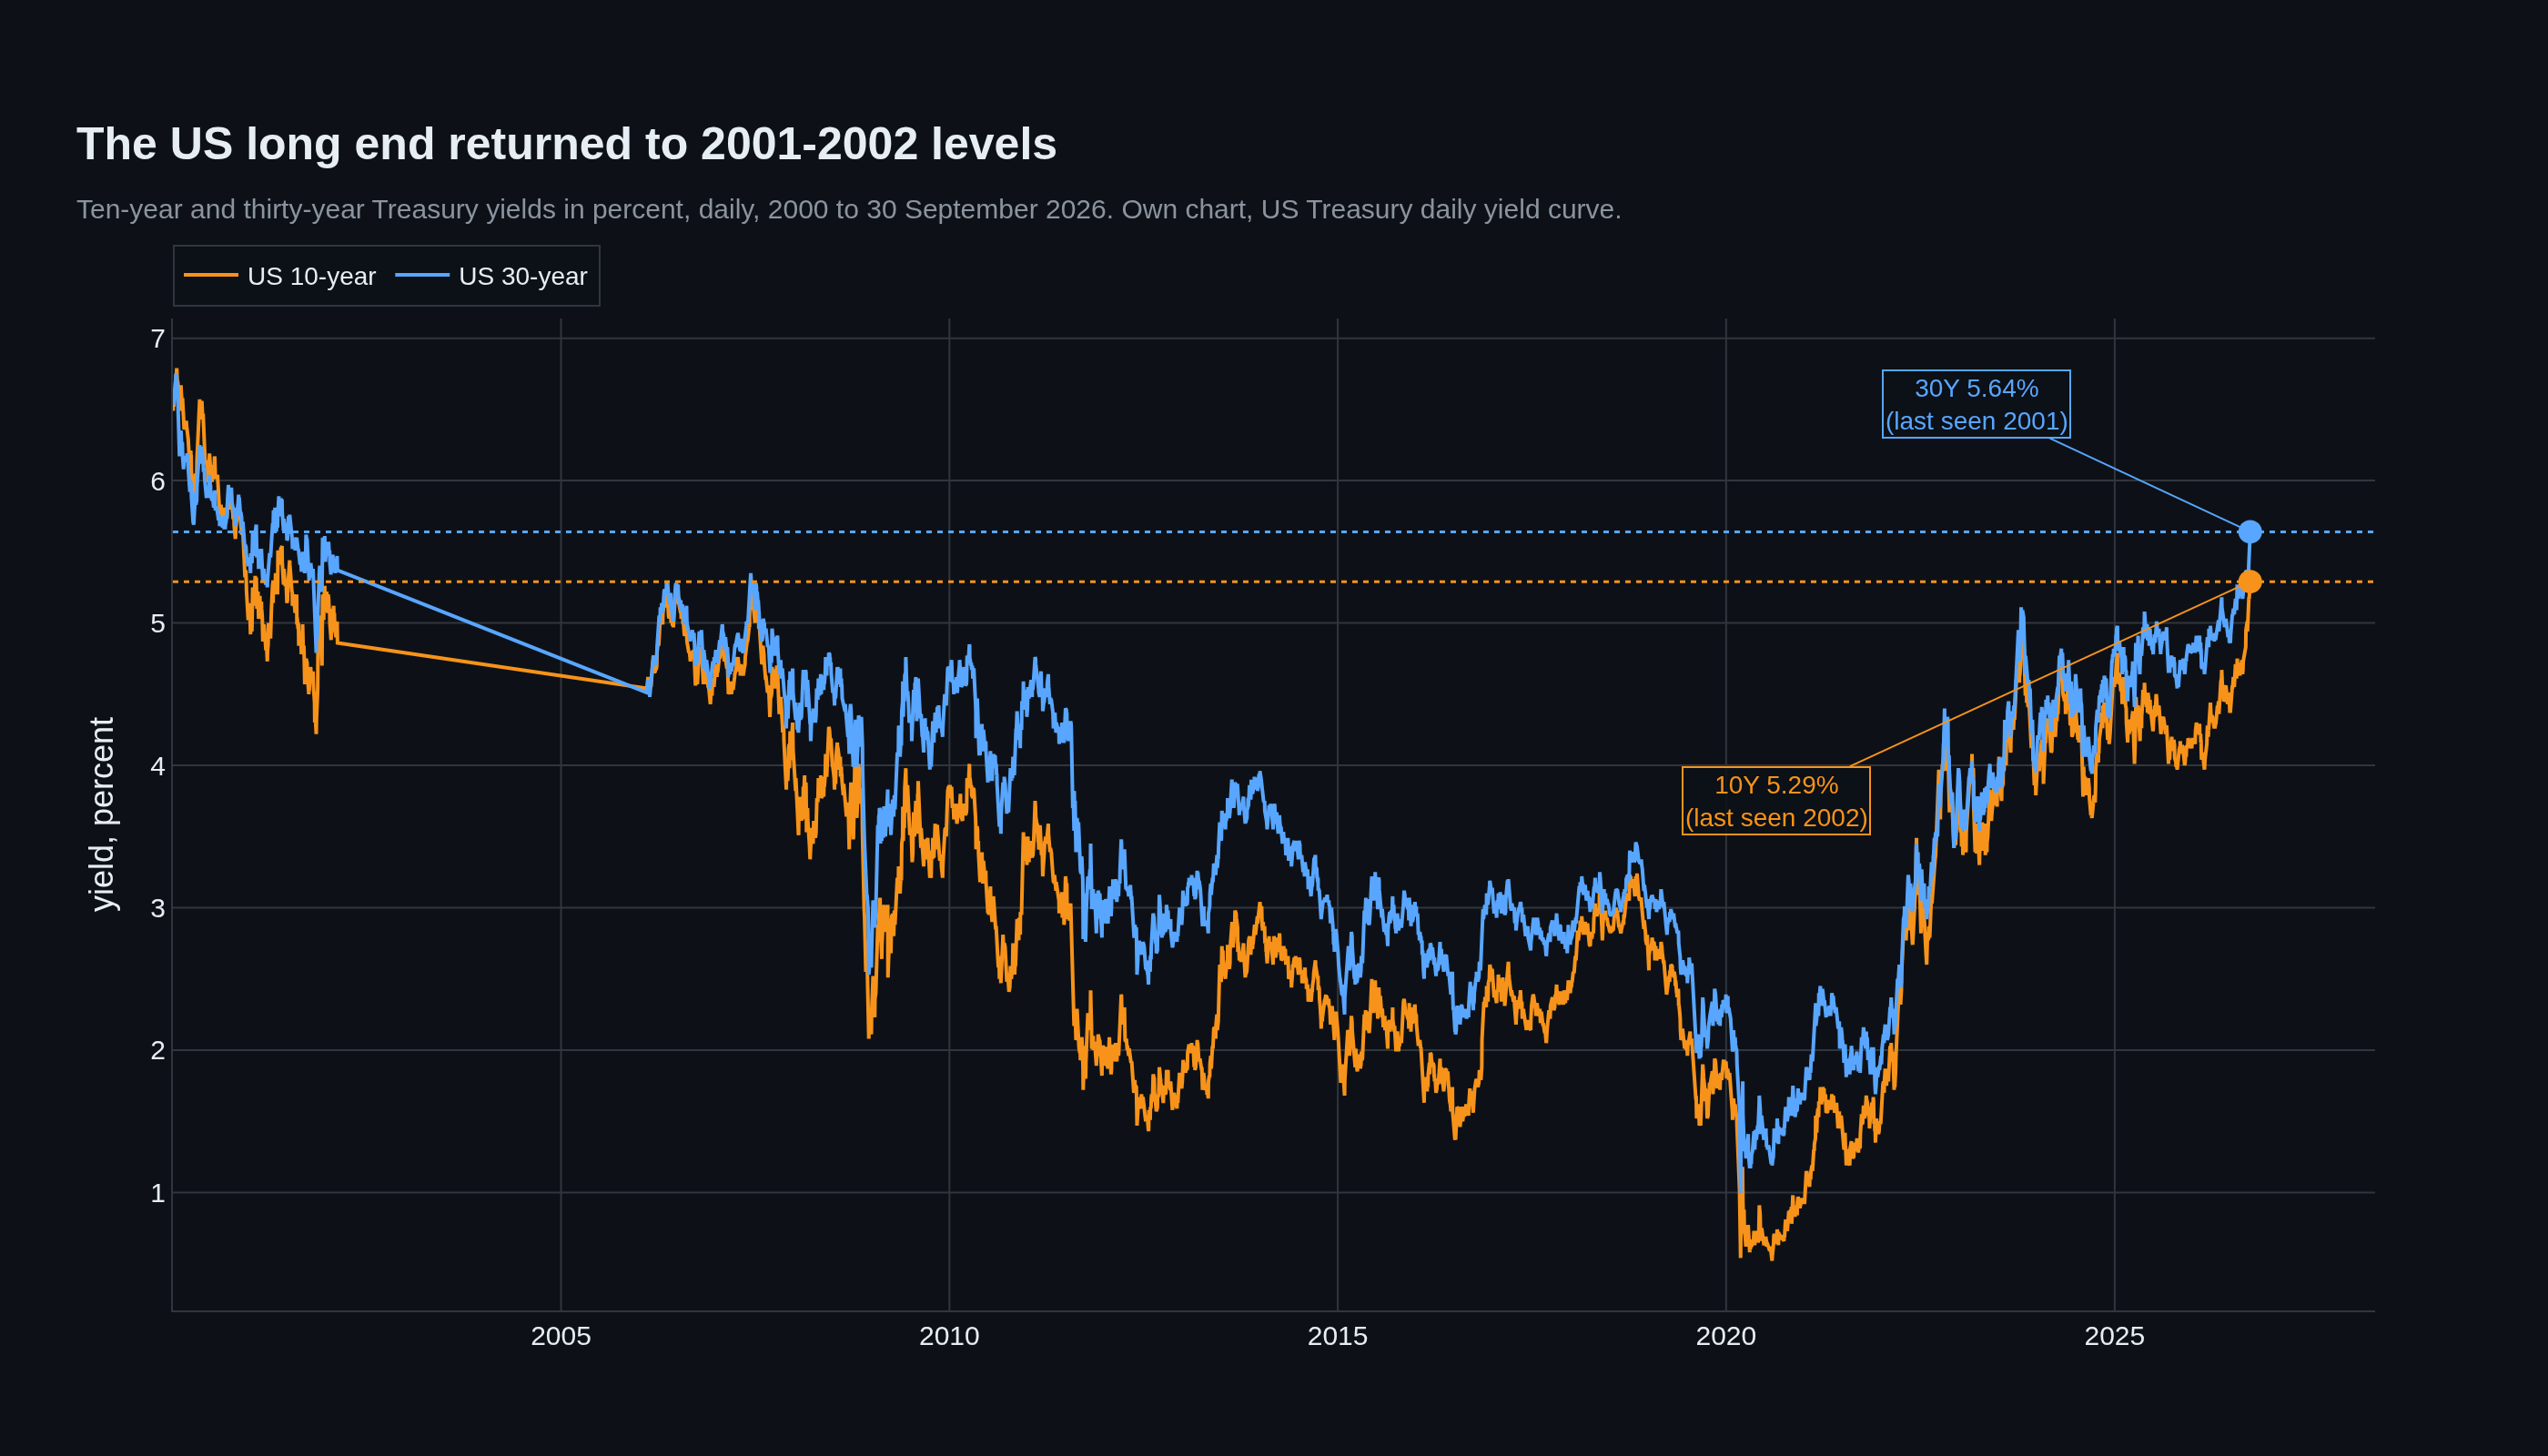
On 30 September the ten-year Treasury closed at 5.29 percent. To find the last close above it you have to go back to 14 May 2002, when the same bond yielded 5.32. The thirty-year settled at 5.64, a level it last printed on 13 July 2001. In the space of nine months the American long bond returned to the yields of the dot-com bust. Nobody declared a crisis. Nothing broke. The market simply asked for more money to lend for a long time, and got it.
That is the event of this autumn, and the newsletters of the last week are all circling it. Cory Klippsten listed four horsemen behind the move: war, growth, debt and Japan. Marty Bent spent his week on something that looked unrelated, a disability surge in two countries. Nik Bhatia noted in passing that Treasuries at these levels will eventually find a buyer, and then moved on to options positioning. Read together, those three pieces describe one mechanism, and it is not the one most people assume.

Four horsemen are one horseman
Klippsten's list is a good list. It is also four names for a single quantity, and the Treasury publishes the decomposition every day. Separate the nominal ten-year into the real yield and the breakeven inflation rate, and the story narrows sharply.
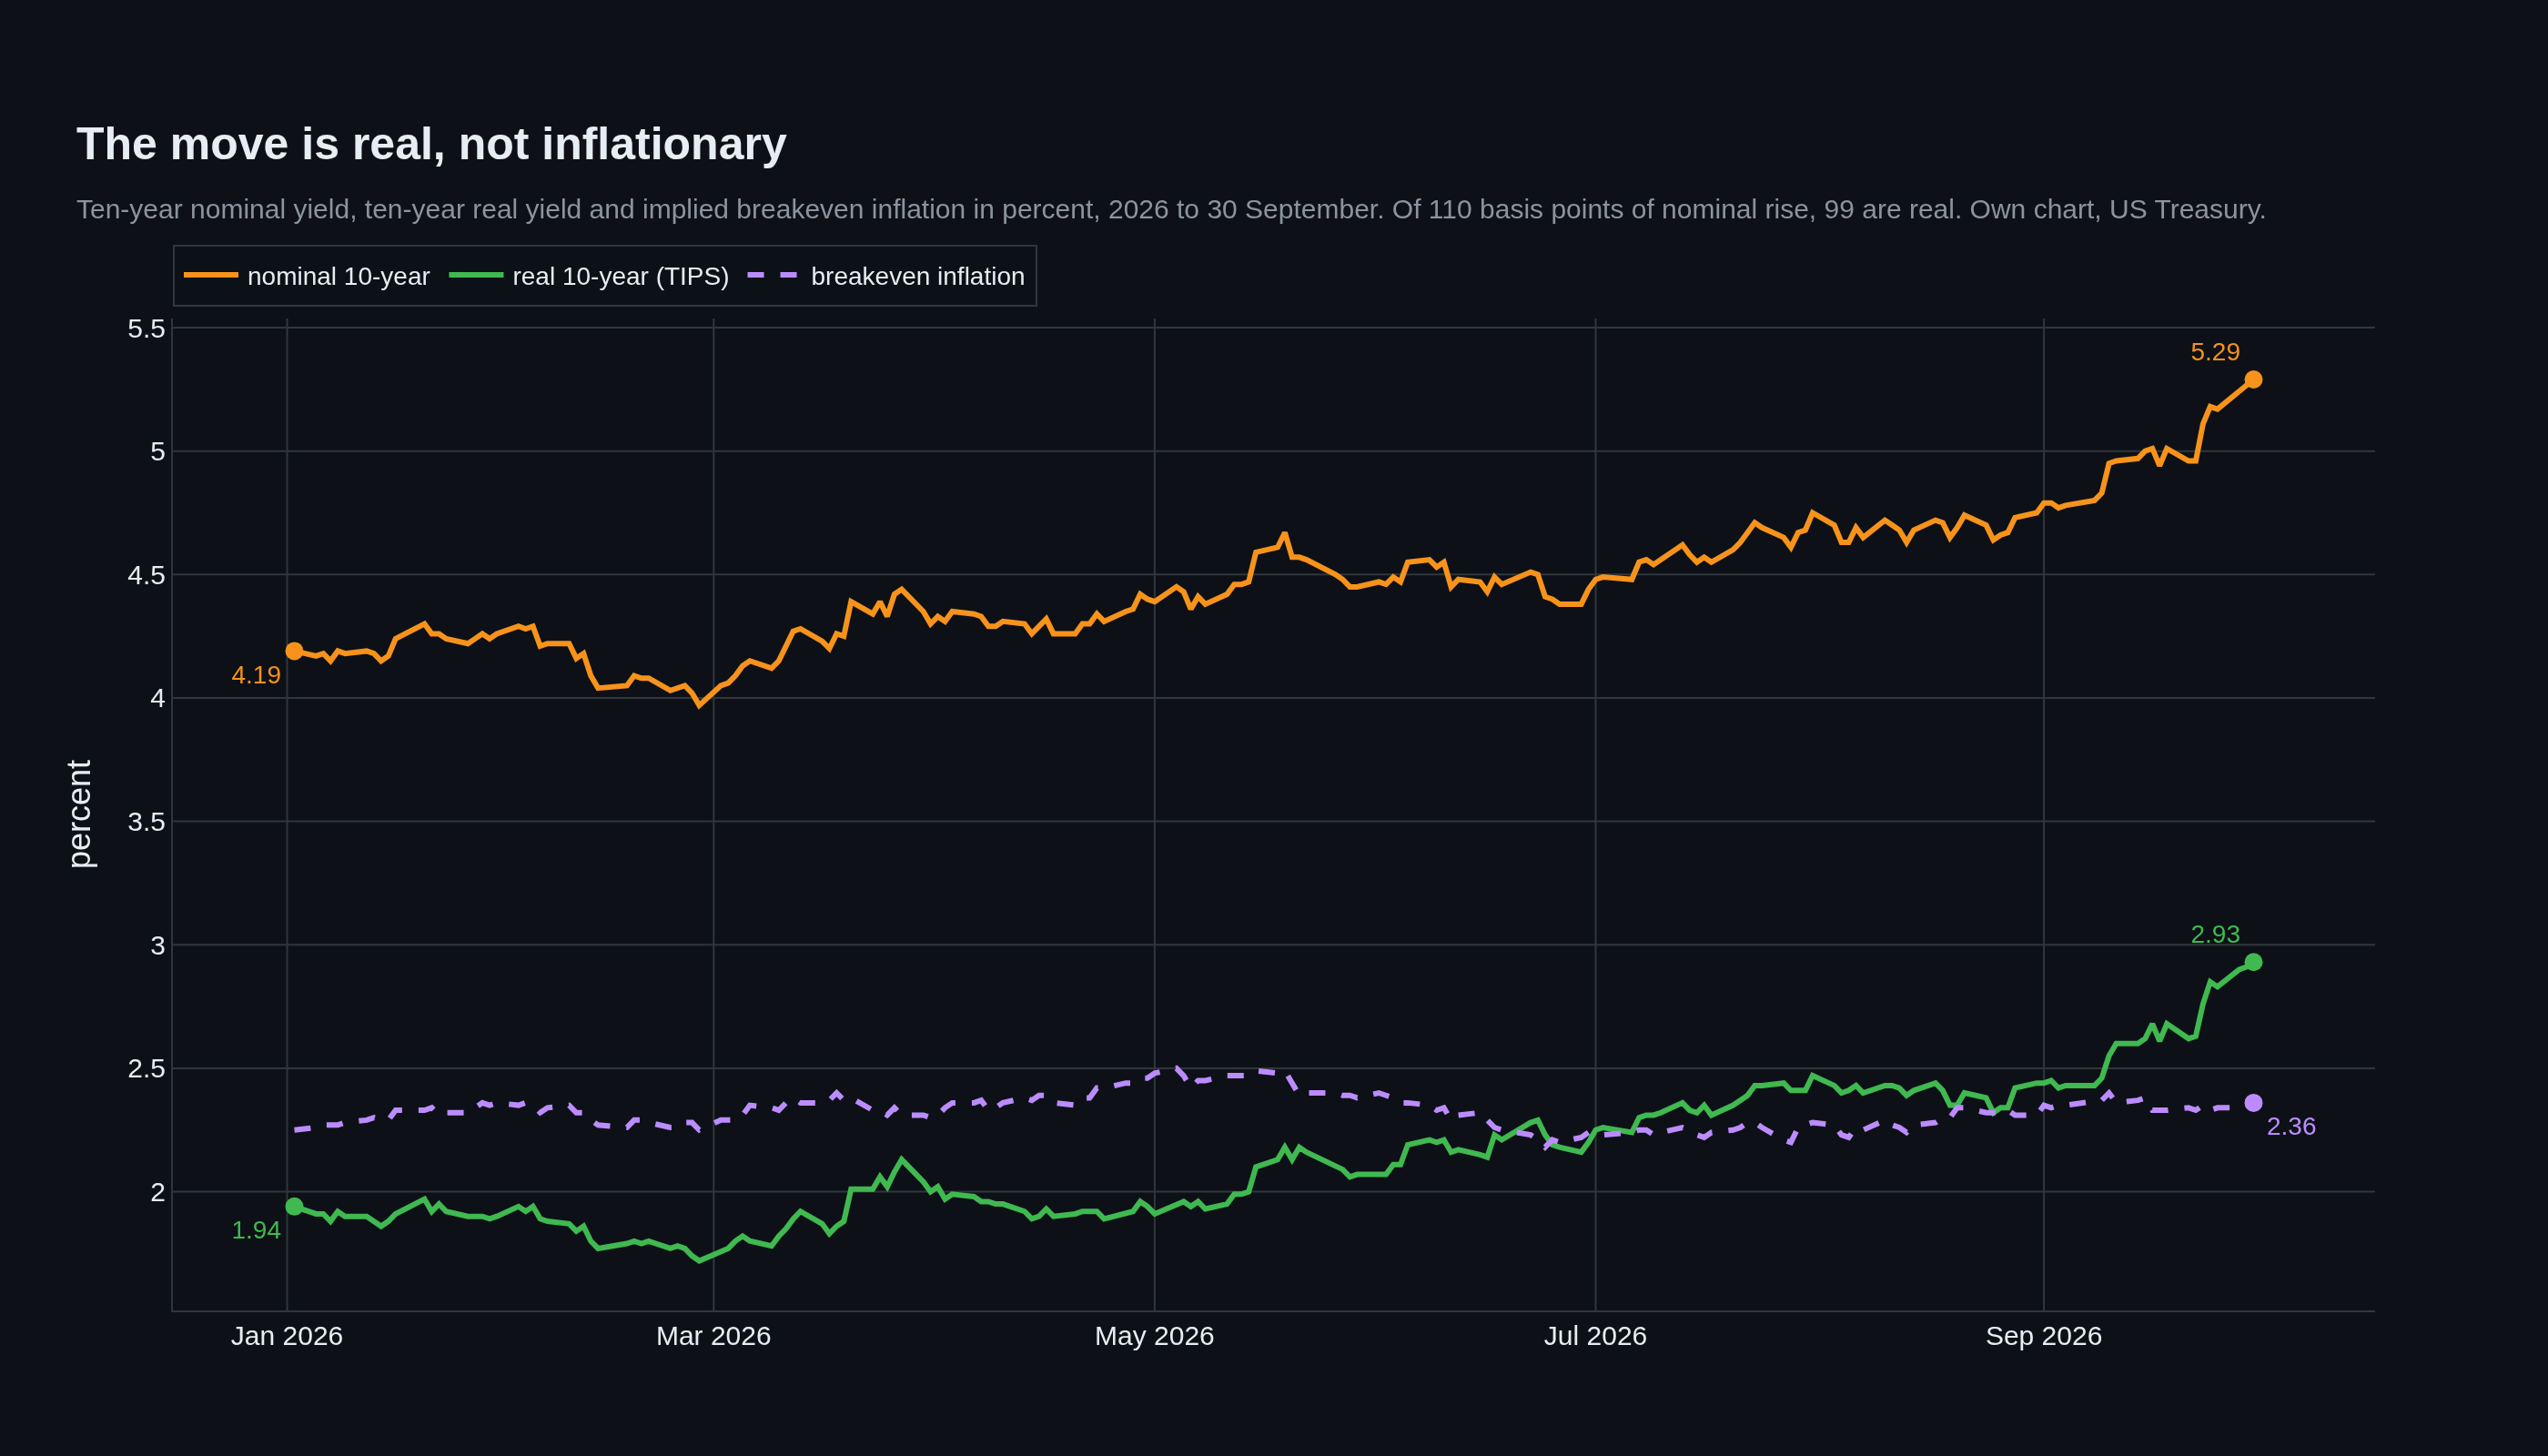
On 2 January 2026 the nominal ten-year sat at 4.19 percent, the real yield on inflation-protected securities at 1.94, and the implied breakeven at 2.25. By 30 September the nominal had moved to 5.29, the real to 2.93, and the breakeven to 2.36. That is 110 basis points of nominal move, of which 99 came from the real yield and 11 from inflation expectations. Nine tenths of this repricing is not a bet on higher prices. It is a demand for a higher real return.

The level matters more than the direction. The ten-year real yield of 2.93 percent has been exceeded on only four trading days in the available history of the series. All four fall in the second half of 2008, with a peak of 3.15 on 21 November. The thirty-year real yield closed at 3.33 percent, which is the highest reading since that series began in February 2010. The Federal Reserve's own term premium estimate, the ACM model, puts the ten-year term premium at 85 basis points on 29 September. That is roughly double where it sat in 2021, and still below the 1.40 percent it reached in 2014.
So the long end is not priced for panic. It is priced for a world where capital is scarce again, and where holding a thirty-year promise to be paid in a currency nobody controls requires actual compensation.
The bid that used to arrive by itself
Klippsten names Japan as the fourth horseman. The Treasury's own custody data says something slightly different, and more mechanical.
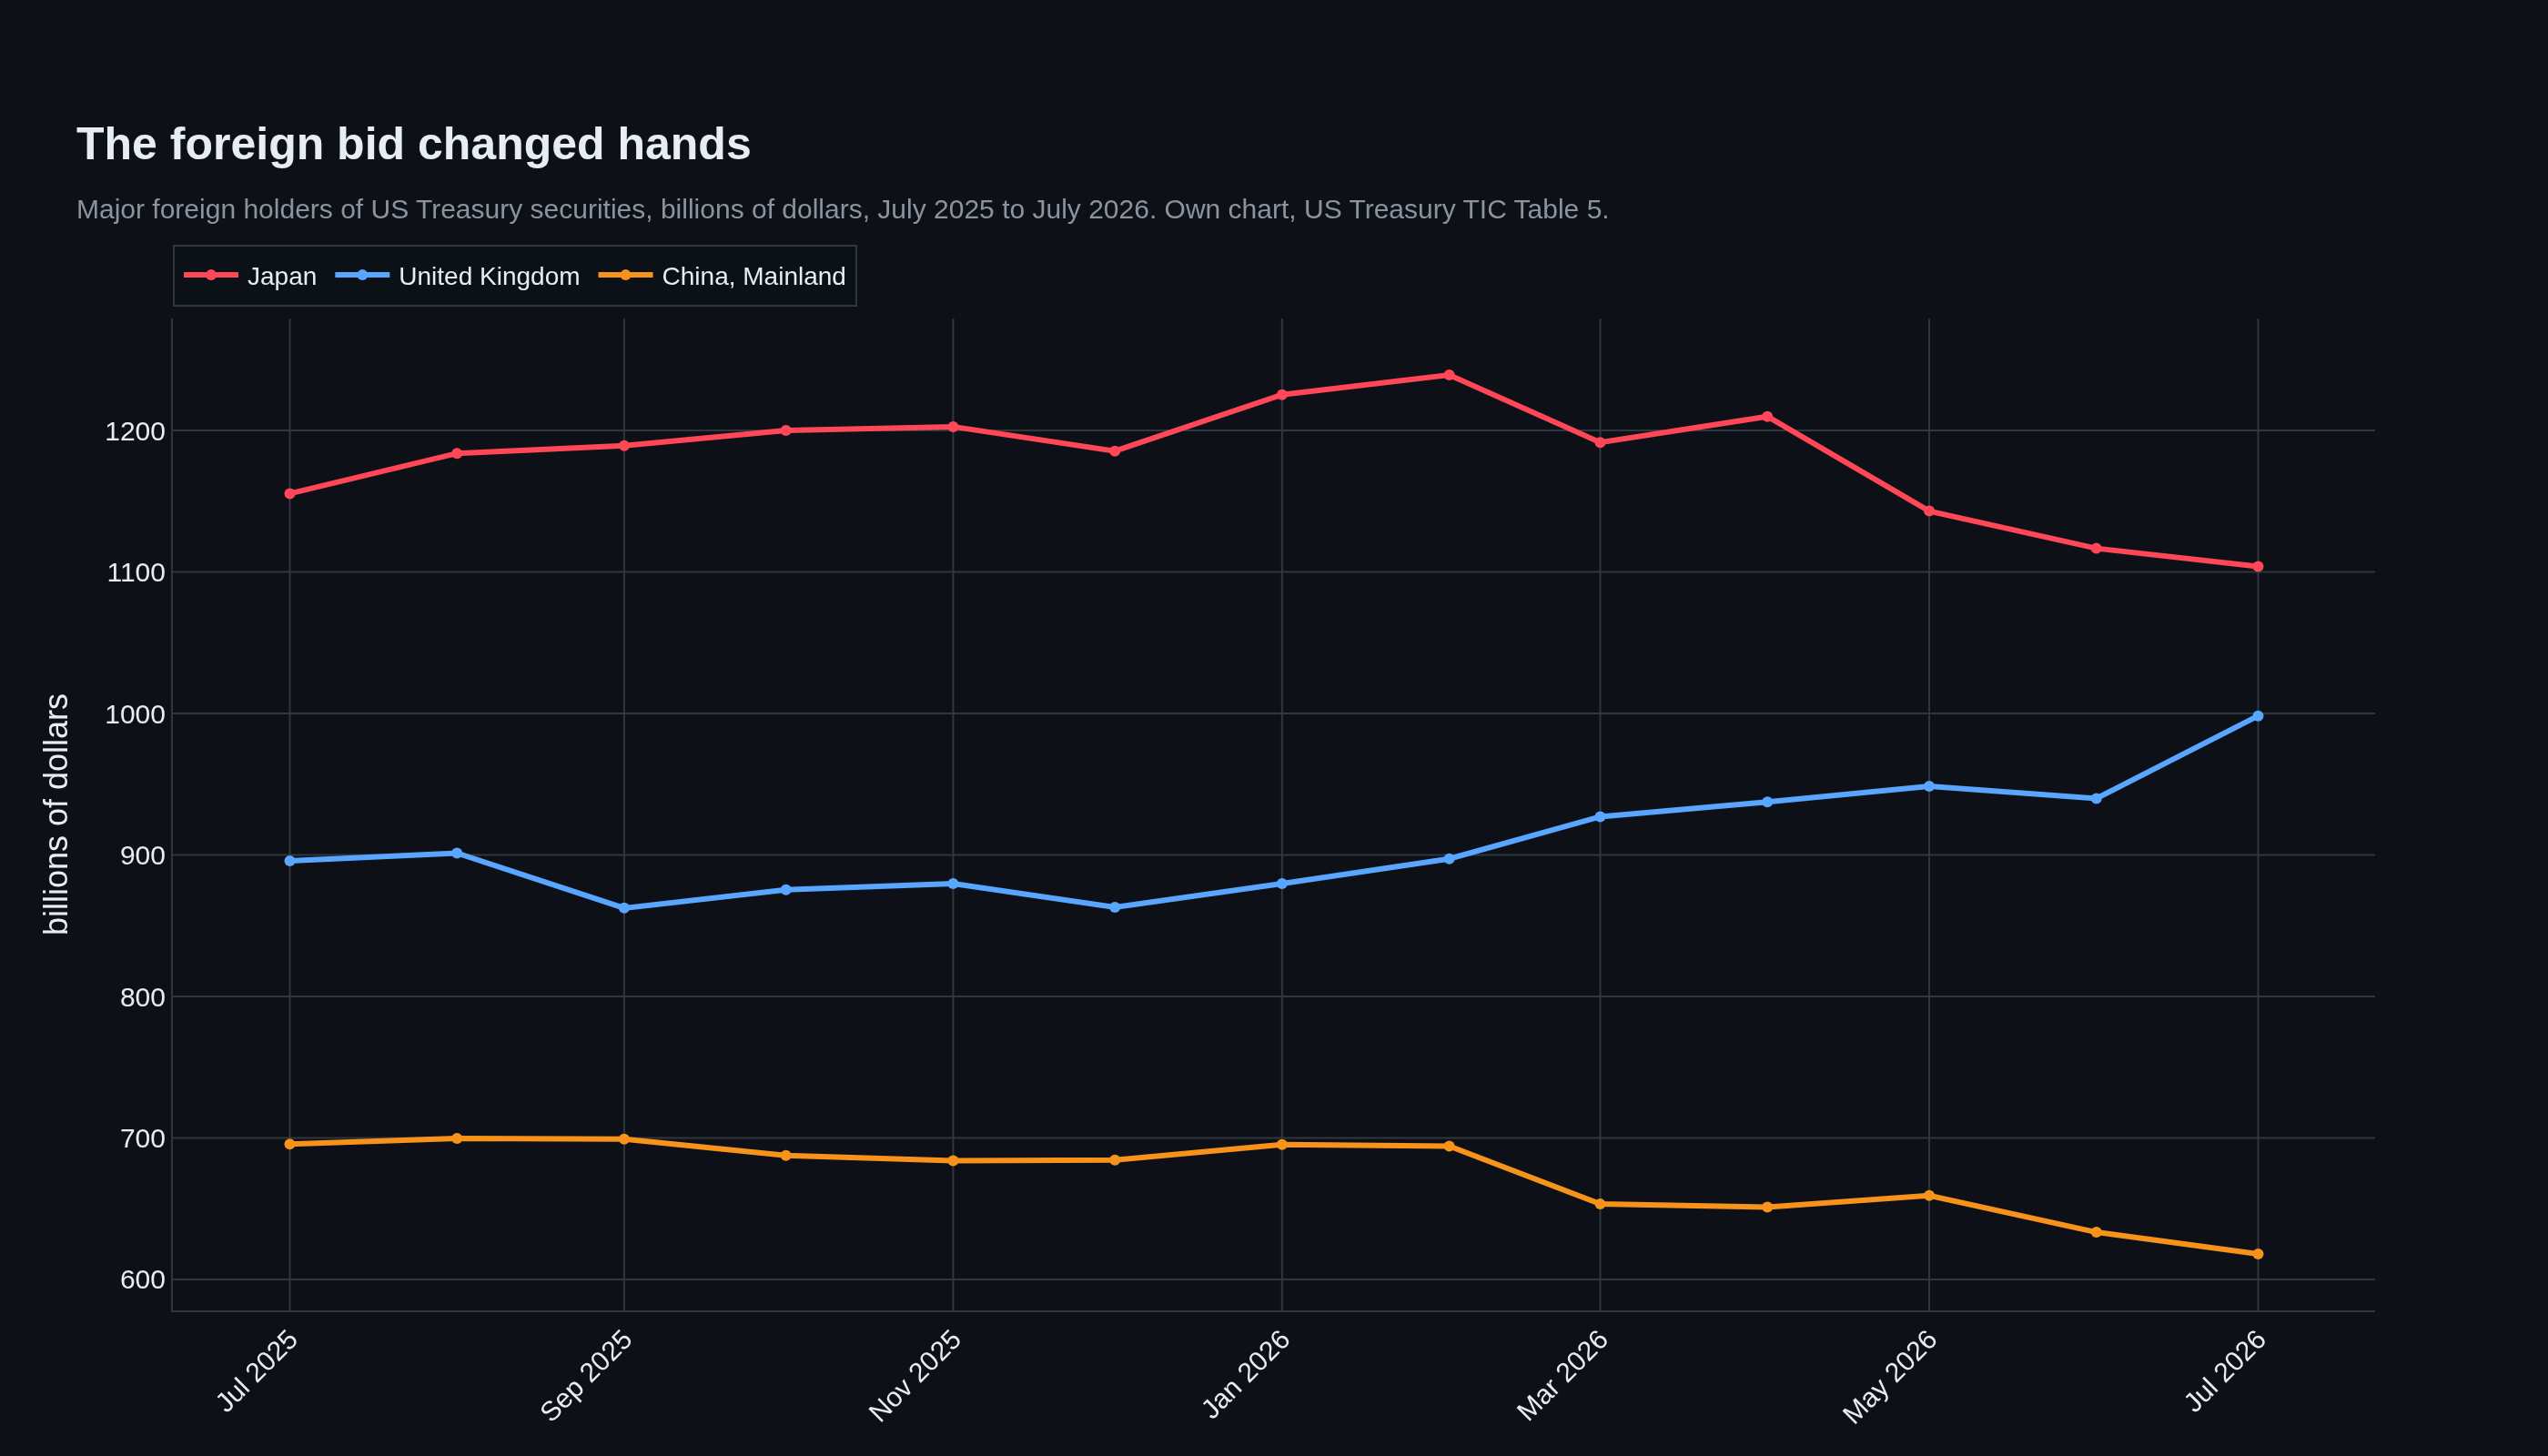
Japanese holdings of US Treasuries were 1,239.3 billion dollars in February 2026. By July they were 1,103.9 billion. That is 135 billion gone in five months, and it happened in the same window in which the Japanese ten-year government bond broke through 3 percent for the first time since September 1996. On 30 September it yielded 3.057. The Japanese thirty-year, a series that starts in 1999, printed its all-time high of 4.098 percent on 30 September as well. A record high rather than a recovery.
The arithmetic of the carry trade is not subtle. A Japanese institution lending to the American government at 5.29 percent earns 223 basis points over its own funding cost at home. That is before hedging. When the funding leg was near zero, as it was for most of two decades, almost any foreign yield cleared the bar. At the current spread that trade is the thinnest it has been in thirty years. The currency risk in the funding leg has also stopped being a rounding error. Japanese capital no longer needs to leave home to earn a return. Some of it is coming back.
The other direction of travel is just as informative. Chinese holdings were 760.8 billion in January 2025. By July 2026 they were 618.0 billion, a reduction of 143 billion. British holdings went the other way, from 862.5 billion in September 2025 to 998.3 billion in July 2026. The composition of the foreign bid is shifting from reserve managers who hold for policy reasons toward private balance sheets that hold for yield. Those two buyers do not behave the same way. A reserve manager buys when a decision is made in a committee room. A private manager buys when the price is right, and sells when it is not.
Chart. Major foreign holders of US Treasury securities in billions of dollars, July 2025 to July 2026. Japan falls from 1,189 to 1,104, the United Kingdom rises from 862 to 998, China falls from 699 to 618. Own chart, US Treasury TIC Table 5.
The compound inside the stock
There is a slower number underneath the market price, and it is the one that does not care about daily quotes.
The weighted average interest rate on all outstanding marketable Treasury debt was 3.475 percent in August 2026. In December 2022 it was 2.320. The average has risen every single month this year, from 3.348 in January to 3.475 in August, which is an increase of 12.7 basis points in seven months. Meanwhile the ten-year market rate is 5.29 percent. The gap between what the Treasury pays on the existing stock and what it must pay on new issuance is 181 basis points. Every refinancing moves the average a little closer to the market, and the market is far above the average.
You can see it in the cash numbers. Gross interest on the public debt was 1,267.4 billion dollars in the first eleven months of fiscal 2026. In the same eleven months of fiscal 2025 it was 1,124.3 billion. The full prior fiscal year, all twelve months, came to 1,215.6 billion. Eleven months of this year already exceed the whole of last year by 52 billion. Net of the interest the government pays itself through the trust funds, the figure is 1,051.4 billion against 941.4 a year earlier [own subtraction of two published Treasury lines].
Here is the part worth sitting with. Receipts in those eleven months rose by 154.6 billion dollars, from 4,690.9 to 4,845.5 billion. Receipts really did rise. There was no revenue shortfall to explain. And the deficit stayed flat, at 1,965.6 billion against 1,973.3 [own subtraction]. The extra revenue arrived, and it was absorbed. Interest is a candidate for a large share of the absorption. It is not the only candidate, and I cannot decompose the difference line by line from the monthly statement, so the attribution stops there.
The other side of the ledger
Now put Marty Bent's piece beside it, because the two are the same story with different units.
Bent reports that the UK's Personal Independence Payment caseload reached 4.1 million claimants in England and Wales as of July 2026. I pulled the Department for Work and Pensions release of 15 September directly. The figure is exact: 4.1 million claimants, 3.4 million of them of working age, and a 2 percent increase on the April count. The DWP also publishes the decision volume and the award rate, and those two together are where the interest story gets its mirror image.
In fiscal 2025-26 the DWP made 720,870 initial PIP decisions after an assessment. In 2021-22 it made 553,080. In 2019-20 it made 541,830. The volume is up roughly a third against the pre-pandemic baseline. The award rate fell over the same stretch, from 62 percent of new claims in 2019-20 to 51 percent in the year just ended. That combination matters. More claims, and a stable-to-lower share of them succeeding, is what you would expect from an increase in people presenting rather than a loosening of the test.
The processing system is feeling it in a second way. The median end-to-end time from registration to a DWP decision was 18 weeks in July 2026. Through most of 2016 and 2018 it was 10. The DWP recorded 144,440 mandatory reconsiderations in 2025-26, which is a fifth of the decision volume.
Bent's American half rests on Ed Dowd's reading of the Current Population Survey, which counts 37,029,000 Americans reporting a disability as of July 2026 against a pre-2021 plateau. I could not verify that number at source. The Bureau of Labor Statistics blocks automated retrieval of its release pages, and the underlying series is not in the Treasury or Fed datasets I use. So I am carrying it as a claim from Dowd via Bent. My own measurement does not exist for it, and the same applies to the Phinance Technologies body-system breakdown that the TFTC piece also cites.
What I can say without leaning on any of it is why the fiscal link runs in the direction it does. A disability caseload is a stream of transfer payments and an absence from the payroll tax base at the same time. It does not appear in the unemployment rate, because these people are not classified as looking for work. It does appear in outlays and in the revenue line, one quarter at a time, with no committee vote and no headline. Bent cites the DWP's spring expenditure tables for PIP spend rising from about 28.5 billion pounds in 2025-26 to 44.7 billion by 2030-31. Whether that projection holds is a policy question. That the direction is up while the clearance time also lengthens is data.
The strongest case against all of this
I have to state the bear case for my own framing, because parts of it are strong.
First, the term premium is not elevated. At 85 basis points on the ACM measure, it is above the 2020-21 trough and well below 2014. A ten-year real yield near 3 percent is close to what a 2 percent inflation target plus trend real growth of 2 to 3 percent arithmetically implies. On that reading, 2026 is not a dislocation. It is the removal of a distortion, and the correct description is normalisation rather than stress.
Second, Bhatia's point is real and I can put a number on it. The ten-year real yield is 2.93 percent, the breakeven is 2.36, and the three-month bill pays 4.20. An investor who thinks inflation will not accelerate earns close to three percent above inflation for locking money up for a decade. At some price, that bid arrives. A carry desk funding near SOFR at 3.90 percent and lending at 5.29 percent earns 139 basis points for taking duration. That spread is the widest it has been in years. High yields create their own buyers. That is exactly what makes a straight-line extrapolation of this chart a bad idea.
Third, the shape of the curve argues against crisis. The two-year is at 4.88 percent against a federal funds target range of 3.75 to 4.00 percent. The market expects more tightening rather than less. The FOMC delivered a quarter point on 16 September by a unanimous 12-0 vote. A curve that is steepening because the front end is anchored by a central bank that is still raising is not the same object as a curve steepening because investors are dumping duration.
Fourth, the custody data is weaker evidence than it looks. TIC figures are reported by custodians, and a holding booked to Belgium or the Cayman Islands is very often a position owned somewhere else entirely. Japan reducing its line item is a fact about a reporting geography as much as about a decision in Tokyo. I have used it above and I want the caveat attached to the same page.
What I could not verify
The BLS disability series, as noted, and the Phinance body-system numbers, both of which I am carrying second-hand. The ACM term premium is a model output rather than a traded price, so it inherits the model's assumptions about expectations. The oil level is a single snapshot taken on 1 October, with Brent at 101.54 dollars and WTI at 92.71, and one day of a war-risk premium is not a trend. The Treasury's monthly statement aggregates many lines, and my interest-versus-deficit comparison uses published totals rather than a full reconciliation. Bitcoin's price is a Kraken daily close, 84,082 dollars on 1 October.
One more honest note. Japan's thirty-year series began in 1999, so "all-time high" means since 1999 and nothing earlier. The ten-year Japanese yield above 3 percent is the first since September 1996, and I checked that at the Ministry of Finance's own historical file rather than taking it from commentary.
Why the fixed-supply asset did not answer
Here is the uncomfortable part, and it is the reason this is worth writing at all.
Bitcoin's all-time high was 124,767 dollars on 6 October 2025. As I write, it is 84,082, which is 32.6 percent below that high and 5.2 percent below where it started 2026. Its low for the year was 58,532 on 30 June. Now set that beside the bond move. Between 30 June and 30 September the ten-year went from 4.44 percent to 5.29. The real ten-year went from 2.20 to 2.93. That is the largest single-quarter repricing of real long rates in years. Over the same three months bitcoin rose from 58,532 to 83,565, then drifted sideways into October.
Both directions of that comparison are awkward for the simple version of the thesis. When real yields spiked, bitcoin had already fallen. When it recovered, it recovered alongside risk appetite rather than against it. The asset with the fixed supply did not outperform the asset with the infinite supply during the quarter when the market finally demanded real compensation for lending to a sovereign.
The mechanism that fits the tape is duration, not scarcity. Bitcoin trades first as the longest-duration asset in the book. Its cash flows are zero today and its whole value sits in a terminal state. That makes it maximally sensitive to the discount rate, and the discount rate went up. Scarcity only asserts itself in the second-order case, when the repricing is about the currency itself rather than about the real return on capital. A repricing driven 99 basis points out of 110 by the real yield is a repricing of capital. It is not a vote of no confidence in the dollar. The 2026 tape is consistent with the first regime. It says nothing yet about the second.
Which is the useful thing to carry into next year. The long end has now repriced without a crisis, without a failed auction, and without a default scare, purely because enough lenders decided the old price was wrong. The Treasury's average cost is 3.475 percent against a market rate of 5.29. That arithmetic works through the stock for years, whatever the ten-year does next. The disability caseloads, British and American, compound on the outlay side on the same schedule. None of that requires anything dramatic. It only requires that the price of lending for a long time stays where the market has just put it.
And the asset that was built for exactly that scenario spent the year trading with the Nasdaq instead.